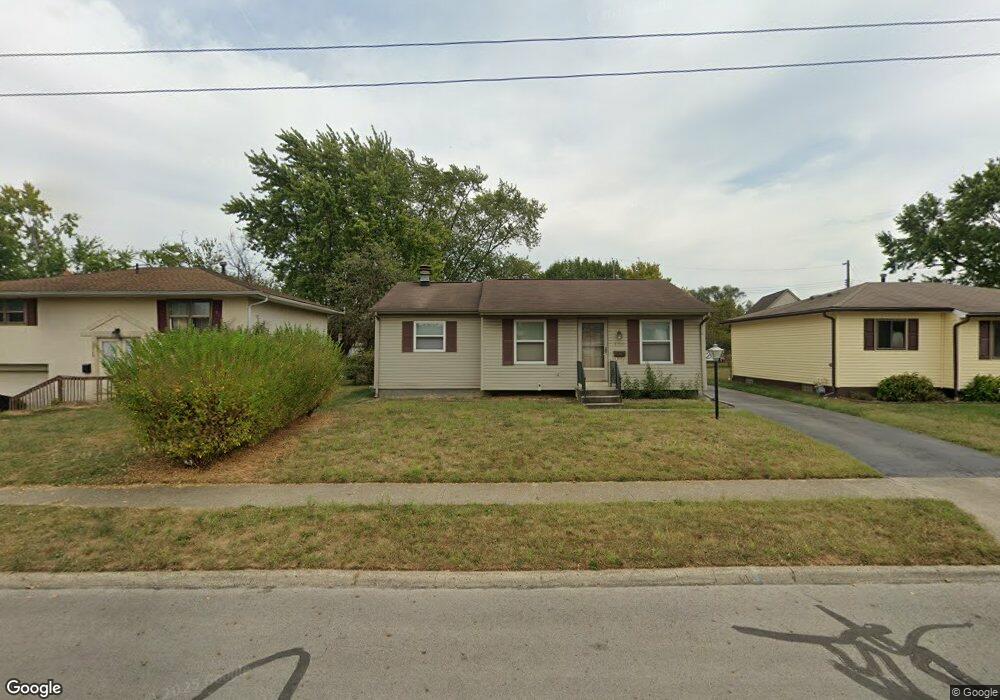
3752 Amwell Rd E Columbus, OH 43207
Obetz-Lockbourne NeighborhoodEstimated Value: $160,000 - $232,000
3
Beds
1
Bath
936
Sq Ft
$210/Sq Ft
Est. Value
About This Home
This home is located at 3752 Amwell Rd E, Columbus, OH 43207 and is currently estimated at $196,701, approximately $210 per square foot. 3752 Amwell Rd E is a home located in Franklin County with nearby schools including Cedarwood Alternative Elementary School @ Stockbri, Buckeye Middle School, and Marion-Franklin High School.
Ownership History
Date
Name
Owned For
Owner Type
Purchase Details
Closed on
Aug 31, 2016
Sold by
Webb James H
Bought by
Webb James H and Jones Linda Sue
Current Estimated Value
Purchase Details
Closed on
Jan 21, 1974
Bought by
Webb James H
Create a Home Valuation Report for This Property
The Home Valuation Report is an in-depth analysis detailing your home's value as well as a comparison with similar homes in the area
Home Values in the Area
Average Home Value in this Area
Purchase History
| Date | Buyer | Sale Price | Title Company |
|---|---|---|---|
| Webb James H | -- | None Available | |
| Webb James H | -- | -- |
Source: Public Records
Tax History Compared to Growth
Tax History
| Year | Tax Paid | Tax Assessment Tax Assessment Total Assessment is a certain percentage of the fair market value that is determined by local assessors to be the total taxable value of land and additions on the property. | Land | Improvement |
|---|---|---|---|---|
| 2024 | $4,948 | $48,860 | $12,740 | $36,120 |
| 2023 | $2,385 | $48,860 | $12,740 | $36,120 |
| 2022 | $1,692 | $30,390 | $8,370 | $22,020 |
| 2021 | $1,124 | $30,390 | $8,370 | $22,020 |
| 2020 | $1,126 | $30,390 | $8,370 | $22,020 |
| 2019 | $1,107 | $26,990 | $7,280 | $19,710 |
| 2018 | $1,159 | $26,990 | $7,280 | $19,710 |
| 2017 | $1,221 | $26,990 | $7,280 | $19,710 |
| 2016 | $1,336 | $28,920 | $5,360 | $23,560 |
| 2015 | $1,213 | $28,920 | $5,360 | $23,560 |
| 2014 | $1,216 | $28,920 | $5,360 | $23,560 |
| 2013 | $644 | $30,415 | $5,635 | $24,780 |
Source: Public Records
Map
Nearby Homes
- 3785 S Ohio Ave
- 3735 Christie Rd W
- 662 Bartfield Dr
- 904 Kyle Ave
- 3573 S Champion Ave
- 895 Robmeyer Dr
- 577 Barcher Rd
- 3691 Ferman Rd
- 0 Williams Rd
- 525 Ashwood Rd
- 696 Williams Rd
- 503 Ashwood Rd
- 812 Breathitt Ave
- 484 Cedarwood Rd
- 1091 Vernon Dr
- 780 Colton Rd
- 3714 Parsons Ave
- 0 Parsons Ave Unit 225012522
- 1101 Meadow Ln
- 369 Chatterly Ln
- 3758 Amwell Rd E
- 3744 Amwell Rd E
- 3764 Amwell Rd E
- 3738 Amwell Rd E
- 3761 S Ohio Ave
- 3753 S Ohio Ave
- 3767 S Ohio Ave
- 3747 S Ohio Ave
- 3730 Amwell Rd E
- 3749 Amwell Rd E
- 3775 S Ohio Ave
- 3757 Amwell Rd E
- 3743 Amwell Rd E
- 3739 S Ohio Ave
- 3776 Amwell Rd E
- 3763 Amwell Rd E
- 3787 S Ohio Ave
- 3724 Amwell Rd E
- 3733 S Ohio Ave
- 3771 Amwell Rd E