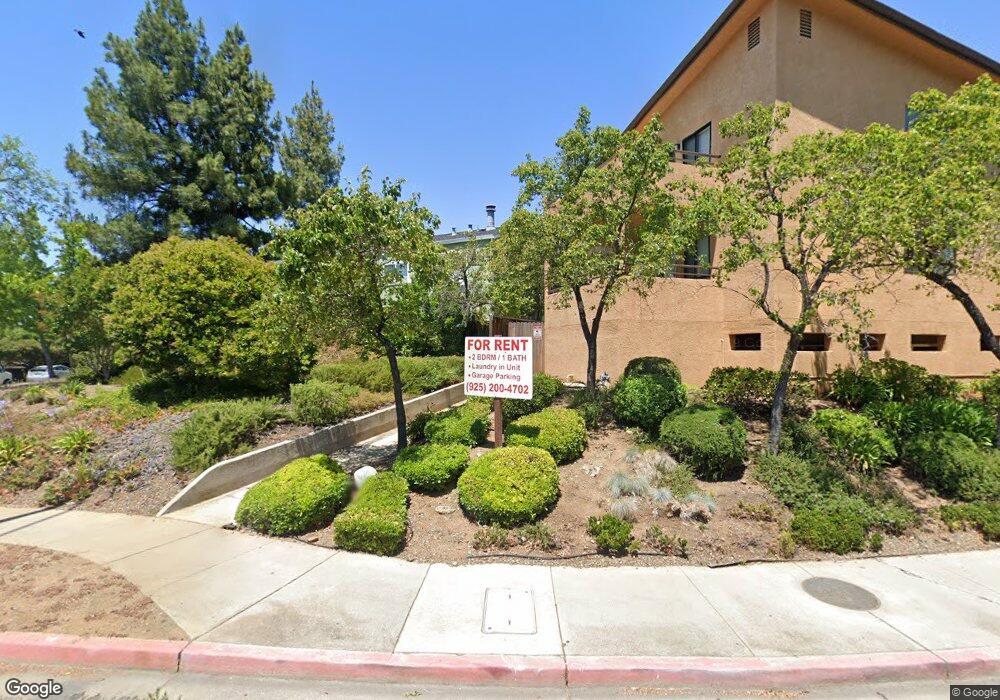
3753 Clayton Rd Concord, CA 94521
Parkside NeighborhoodEstimated Value: $496,000 - $663,000
2
Beds
2
Baths
1,108
Sq Ft
$486/Sq Ft
Est. Value
About This Home
This home is located at 3753 Clayton Rd, Concord, CA 94521 and is currently estimated at $538,342, approximately $485 per square foot. 3753 Clayton Rd is a home located in Contra Costa County with nearby schools including Wren Avenue Elementary School, El Dorado Middle School, and Concord High School.
Ownership History
Date
Name
Owned For
Owner Type
Purchase Details
Closed on
Oct 27, 2006
Sold by
Kokurins Roman and Protopopova Jelena
Bought by
Hodge Alan Cort and Hodge Oksoon
Current Estimated Value
Home Financials for this Owner
Home Financials are based on the most recent Mortgage that was taken out on this home.
Original Mortgage
$320,000
Outstanding Balance
$187,035
Interest Rate
6%
Mortgage Type
Purchase Money Mortgage
Estimated Equity
$351,307
Purchase Details
Closed on
Jul 28, 2004
Sold by
Trigueros Rachel Marie
Bought by
Kokurins Roman and Protopopova Jelena
Home Financials for this Owner
Home Financials are based on the most recent Mortgage that was taken out on this home.
Original Mortgage
$246,750
Interest Rate
6.29%
Mortgage Type
Stand Alone First
Purchase Details
Closed on
Nov 6, 2001
Sold by
Ekstrom Susan Elaine
Bought by
Trigueros Rachel Marie
Home Financials for this Owner
Home Financials are based on the most recent Mortgage that was taken out on this home.
Original Mortgage
$156,750
Interest Rate
6.25%
Mortgage Type
Purchase Money Mortgage
Create a Home Valuation Report for This Property
The Home Valuation Report is an in-depth analysis detailing your home's value as well as a comparison with similar homes in the area
Home Values in the Area
Average Home Value in this Area
Purchase History
| Date | Buyer | Sale Price | Title Company |
|---|---|---|---|
| Hodge Alan Cort | $400,000 | Placer Title Company | |
| Kokurins Roman | $329,000 | Ticor Title Company | |
| Trigueros Rachel Marie | $209,000 | American Title Co | |
| Ekstrom Susan Elaine | -- | American Title Co |
Source: Public Records
Mortgage History
| Date | Status | Borrower | Loan Amount |
|---|---|---|---|
| Open | Hodge Alan Cort | $320,000 | |
| Previous Owner | Kokurins Roman | $246,750 | |
| Previous Owner | Trigueros Rachel Marie | $156,750 | |
| Closed | Kokurins Roman | $49,021 |
Source: Public Records
Tax History
| Year | Tax Paid | Tax Assessment Tax Assessment Total Assessment is a certain percentage of the fair market value that is determined by local assessors to be the total taxable value of land and additions on the property. | Land | Improvement |
|---|---|---|---|---|
| 2025 | $6,902 | $535,899 | $316,181 | $219,718 |
| 2024 | $6,592 | $525,392 | $309,982 | $215,410 |
| 2023 | $6,592 | $515,091 | $303,904 | $211,187 |
| 2022 | $6,499 | $504,993 | $297,946 | $207,047 |
| 2021 | $5,743 | $442,000 | $261,000 | $181,000 |
| 2019 | $5,552 | $422,000 | $248,980 | $173,020 |
| 2018 | $6,234 | $380,000 | $224,200 | $155,800 |
| 2017 | $5,916 | $361,000 | $212,990 | $148,010 |
| 2016 | $4,464 | $348,500 | $205,615 | $142,885 |
| 2015 | $4,136 | $319,500 | $188,505 | $130,995 |
| 2014 | $3,002 | $220,000 | $129,800 | $90,200 |
Source: Public Records
Map
Nearby Homes
- 3745 Clayton Rd
- 1579 Farm Bureau Rd
- 3641 Clayton Rd Unit 34
- 3905 Clayton Rd Unit 37
- 3562 Kimball Way
- 1579 West St
- 0 Walnut Ave
- 3479 Rose Ct
- 4081 Clayton Rd Unit 201
- 1449 Cape Cod Way
- 1777 Clayton Way
- 4055 Kimberly Place
- 1455 Grove Way
- 4054 Kimberly Place
- 4095 Hamlet Dr
- 3622 Delancey Ln
- 4185 Huckleberry Dr
- 4045 Sacramento St
- 1715 Copperleaf Ct
- 1693 Greentree Dr
- 3751 Clayton Rd
- 3749 Clayton Rd
- 3747 Clayton Rd
- 3741 Clayton Rd
- 3743 Clayton Rd
- 1519 Farm Bureau Rd
- 1519 Farm Bureau Rd
- 1519 Farm Bureau Rd Unit A
- 3739 Clayton Rd
- 3737 Clayton Rd
- 3735 Clayton Rd
- 3733 Clayton Rd
- 1537 Farm Bureau Rd
- 3755 Clayton Rd
- 3731 Clayton Rd
- 1510 Farm Bureau Rd
- 3729 Clayton Rd
- 3764 Clayton Rd
- 3727 Clayton Rd
- 1499 Fox Hollow Ct Unit A
Your Personal Tour Guide
Ask me questions while you tour the home.