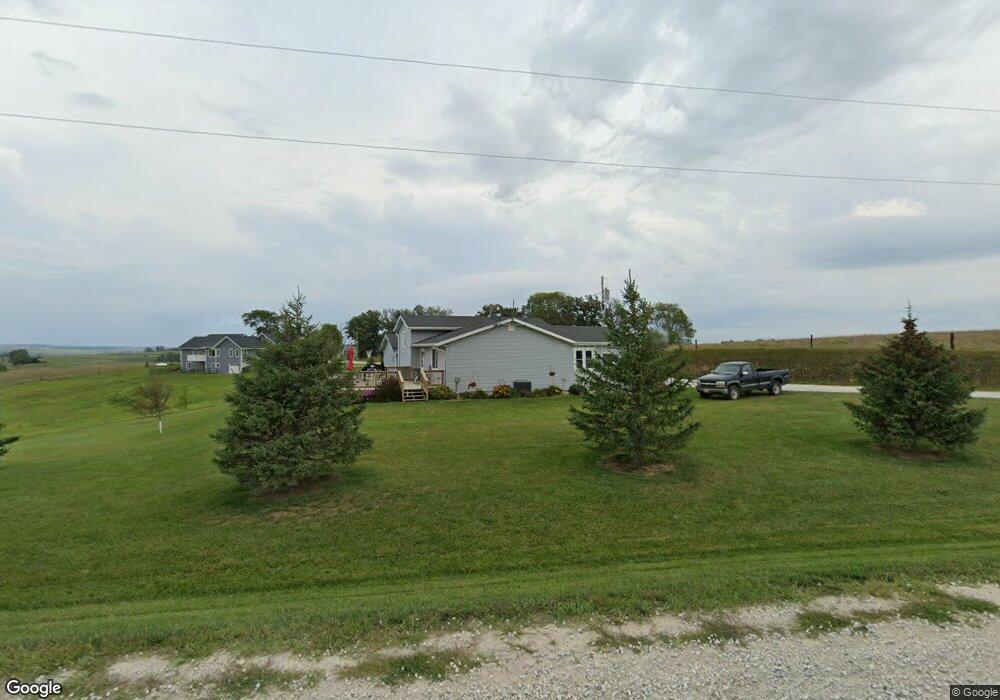
3755 Ullin Place Dunlap, IA 51529
Estimated Value: $195,000 - $325,000
2
Beds
1
Bath
1,032
Sq Ft
$258/Sq Ft
Est. Value
About This Home
This home is located at 3755 Ullin Place, Dunlap, IA 51529 and is currently estimated at $265,919, approximately $257 per square foot. 3755 Ullin Place is a home located in Harrison County with nearby schools including Boyer Valley Elementary School and Boyer Valley Middle/High School.
Ownership History
Date
Name
Owned For
Owner Type
Purchase Details
Closed on
Oct 12, 2016
Sold by
Schaben Cody and Schaben Jill
Bought by
Tremel Sara A
Current Estimated Value
Purchase Details
Closed on
Aug 15, 2008
Sold by
Schaben Cody and Schaben Jill
Bought by
Schaben Cody and Schaben Jill
Home Financials for this Owner
Home Financials are based on the most recent Mortgage that was taken out on this home.
Original Mortgage
$150,000
Interest Rate
6.31%
Mortgage Type
Future Advance Clause Open End Mortgage
Purchase Details
Closed on
Jul 17, 2008
Sold by
Federal Home Loan Mortgage Corporation
Bought by
Schaben Cody and Beaman Jill
Home Financials for this Owner
Home Financials are based on the most recent Mortgage that was taken out on this home.
Original Mortgage
$150,000
Interest Rate
6.31%
Mortgage Type
Future Advance Clause Open End Mortgage
Create a Home Valuation Report for This Property
The Home Valuation Report is an in-depth analysis detailing your home's value as well as a comparison with similar homes in the area
Home Values in the Area
Average Home Value in this Area
Purchase History
| Date | Buyer | Sale Price | Title Company |
|---|---|---|---|
| Tremel Sara A | $160,000 | None Available | |
| Schaben Cody | -- | None Available | |
| Schaben Cody | -- | None Available |
Source: Public Records
Mortgage History
| Date | Status | Borrower | Loan Amount |
|---|---|---|---|
| Previous Owner | Schaben Cody | $150,000 |
Source: Public Records
Tax History Compared to Growth
Tax History
| Year | Tax Paid | Tax Assessment Tax Assessment Total Assessment is a certain percentage of the fair market value that is determined by local assessors to be the total taxable value of land and additions on the property. | Land | Improvement |
|---|---|---|---|---|
| 2025 | $2,762 | $264,560 | $28,600 | $235,960 |
| 2024 | $2,762 | $232,190 | $28,600 | $203,590 |
| 2023 | $2,662 | $232,190 | $28,600 | $203,590 |
| 2022 | $2,410 | $180,965 | $28,600 | $152,365 |
| 2021 | $2,410 | $180,965 | $28,600 | $152,365 |
| 2020 | $2,150 | $163,726 | $28,600 | $135,126 |
| 2019 | $1,718 | $163,726 | $28,600 | $135,126 |
| 2018 | $1,734 | $126,262 | $0 | $0 |
| 2017 | $1,666 | $126,262 | $0 | $0 |
| 2016 | $1,720 | $126,262 | $0 | $0 |
| 2015 | $1,720 | $113,749 | $0 | $0 |
| 2014 | $1,562 | $113,749 | $0 | $0 |
Source: Public Records
Map
Nearby Homes
- 3753 Ullin Place
- 1103 Harrison Rd
- Sec 5 Harrison Rd
- 3781 Ullin Place
- 1506 Eaton St
- 1321 Harrison Rd
- 1410 Eaton St
- 4 Pleasant View Cir
- 1408 Eaton St
- 1211 Remsen St
- 1210 Remsen St
- 1 Pleasant View Cir
- 1202 Remsen St
- 1405 Eaton St
- 1404 Eaton St
- 1206 Remsen St
- 1151 Ute Ave
- 12 Park View Cir
- 1207 Remsen St
- 1204 Remsen St