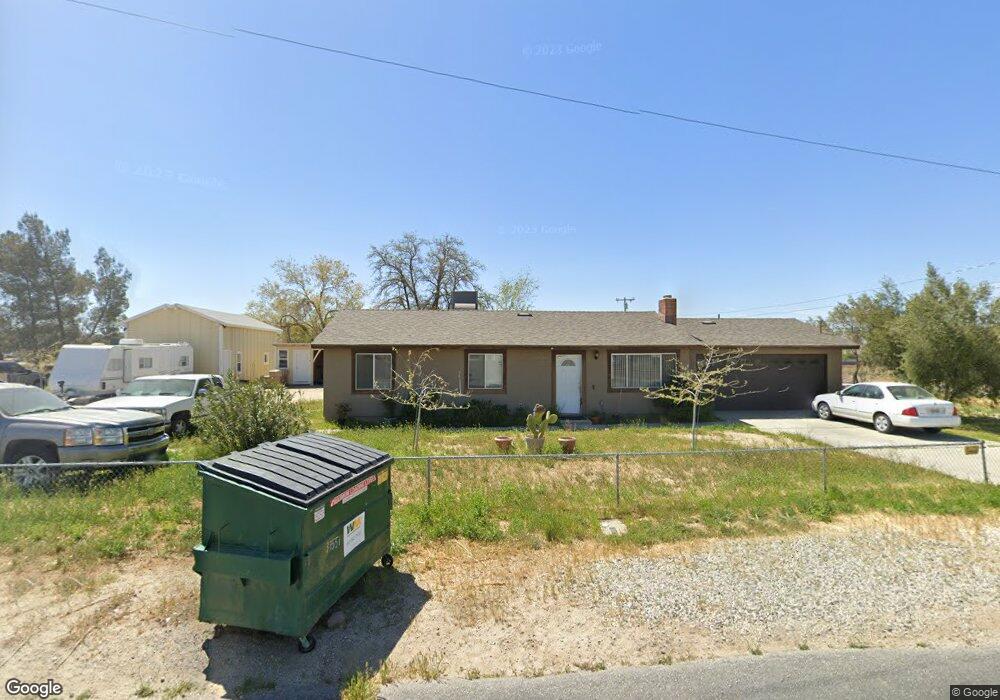
37551 105th St E Littlerock, CA 93543
Estimated Value: $412,179 - $457,000
3
Beds
2
Baths
1,050
Sq Ft
$413/Sq Ft
Est. Value
About This Home
This home is located at 37551 105th St E, Littlerock, CA 93543 and is currently estimated at $433,795, approximately $413 per square foot. 37551 105th St E is a home located in Los Angeles County with nearby schools including Daisy Gibson Elementary School, Keppel Academy, and Littlerock High School.
Ownership History
Date
Name
Owned For
Owner Type
Purchase Details
Closed on
Mar 1, 2006
Sold by
Alcala Manuel and Alcala Delfina
Bought by
Alcala Manuel and Alcala Delfina
Current Estimated Value
Home Financials for this Owner
Home Financials are based on the most recent Mortgage that was taken out on this home.
Original Mortgage
$74,459
Interest Rate
6.08%
Mortgage Type
FHA
Purchase Details
Closed on
May 9, 1995
Sold by
Lyell Mary
Bought by
Alcala Manuel and Alcala Delfina
Home Financials for this Owner
Home Financials are based on the most recent Mortgage that was taken out on this home.
Original Mortgage
$81,413
Interest Rate
7.92%
Mortgage Type
FHA
Create a Home Valuation Report for This Property
The Home Valuation Report is an in-depth analysis detailing your home's value as well as a comparison with similar homes in the area
Home Values in the Area
Average Home Value in this Area
Purchase History
| Date | Buyer | Sale Price | Title Company |
|---|---|---|---|
| Alcala Manuel | -- | First American Title | |
| Alcala Manuel | $81,500 | World Title Company |
Source: Public Records
Mortgage History
| Date | Status | Borrower | Loan Amount |
|---|---|---|---|
| Closed | Alcala Manuel | $74,459 | |
| Previous Owner | Alcala Manuel | $81,413 |
Source: Public Records
Tax History
| Year | Tax Paid | Tax Assessment Tax Assessment Total Assessment is a certain percentage of the fair market value that is determined by local assessors to be the total taxable value of land and additions on the property. | Land | Improvement |
|---|---|---|---|---|
| 2025 | $3,337 | $280,913 | $75,596 | $205,317 |
| 2024 | $3,337 | $275,406 | $74,114 | $201,292 |
| 2023 | $3,265 | $270,007 | $72,661 | $197,346 |
| 2022 | $3,208 | $264,714 | $71,237 | $193,477 |
| 2021 | $3,150 | $259,525 | $69,841 | $189,684 |
| 2019 | $3,057 | $251,829 | $67,770 | $184,059 |
| 2018 | $3,018 | $246,892 | $66,442 | $180,450 |
| 2016 | $2,128 | $174,000 | $43,500 | $130,500 |
| 2015 | $2,126 | $174,000 | $43,500 | $130,500 |
| 2014 | $1,959 | $156,700 | $39,200 | $117,500 |
Source: Public Records
Map
Nearby Homes
- 0 Cor Avenue R8 145th Ste
- 10319 E Avenue r8
- 10306 E Avenue r10
- 0 Ave R6 Vic 105 Ste
- 10347 E Avenue R 12
- 10645 E Avenue r12
- 0 E Vic Avenue R 84th Ste St
- 0 E Avenue R 10
- 10041 E Avenue r6
- 0 Ave R4 Drt Vic 108th St Unit 26002042
- 10231 E Avenue r2
- 10817 E Avenue r12
- 10708 E Avenue R 14
- 10837 E Avenue r10
- 10247 East Ave S
- 0 Cor Ave R8 100th Ste Unit 25005146
- 0 East Ave S
- 9249 E Avenue R 4
- 9249 E East Ave R4
- 0 Cor 110th Unit Ste Pav
- 10342 E Avenue r8
- 10506 E Avenue r8
- 10505 E Avenue r8
- 10332 E Avenue r8
- 10357 E Avenue r8
- 10516 E Avenue r8
- 10515 E Avenue r8
- 10357 E Avenue r10
- 10318 E Avenue r8
- 10526 E Avenue r8
- 10533 E Avenue r8
- 0 0 Vac 92nd Ste Vic Avenue R8 Unit Ste Vic
- 0 R10 Vac Ave Littlerock Unit 20005904
- 10319 Ave 8
- 10513 E Avenue r10
- 10308 E Avenue r8
- 10307 E Avenue r8
- 10546 E Avenue r8
- 10333 E Avenue r10
- 10519 E Avenue r10
Your Personal Tour Guide
Ask me questions while you tour the home.