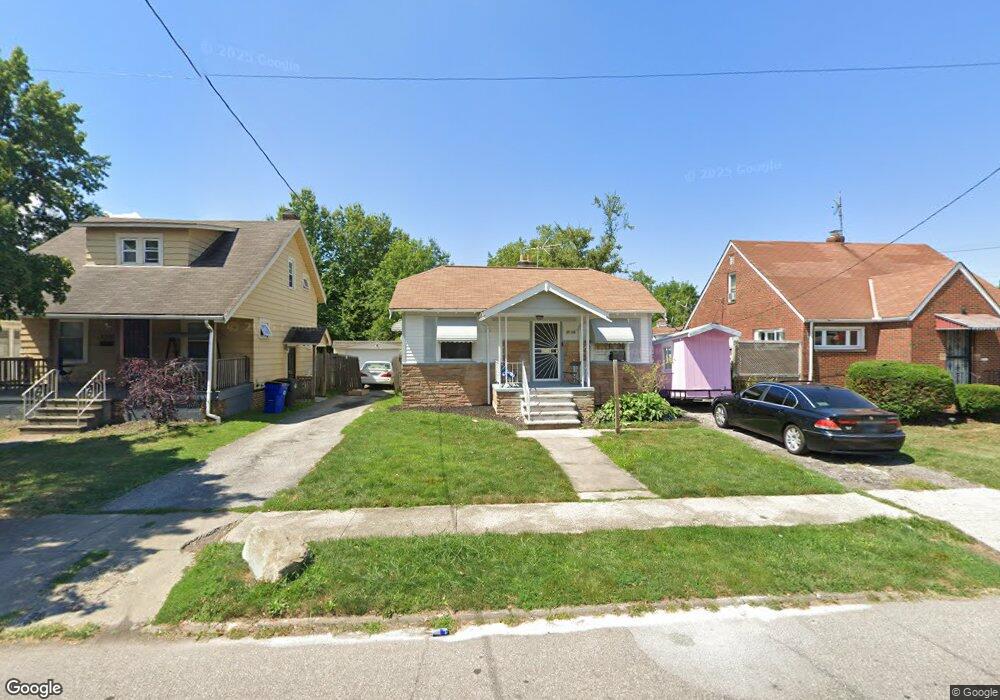
3756 E 149th St Cleveland, OH 44128
Mount Pleasant NeighborhoodEstimated Value: $79,000 - $126,000
3
Beds
2
Baths
1,132
Sq Ft
$86/Sq Ft
Est. Value
About This Home
This home is located at 3756 E 149th St, Cleveland, OH 44128 and is currently estimated at $97,485, approximately $86 per square foot. 3756 E 149th St is a home located in Cuyahoga County with nearby schools including Andrew J. Rickoff School, Adlai Stevenson School, and Anton Grdina School.
Ownership History
Date
Name
Owned For
Owner Type
Purchase Details
Closed on
Mar 24, 2017
Sold by
Third Federal Savings And Loan Associati
Bought by
Washington Investment Company Llc
Current Estimated Value
Purchase Details
Closed on
Mar 3, 2017
Sold by
Third Federal Savings And Loan Asset Of
Bought by
Third Federal Savings And Loan Asset Of
Purchase Details
Closed on
Aug 25, 1995
Sold by
Haygood Dennis J
Bought by
Fortson James V
Home Financials for this Owner
Home Financials are based on the most recent Mortgage that was taken out on this home.
Original Mortgage
$31,150
Interest Rate
7.43%
Mortgage Type
New Conventional
Purchase Details
Closed on
Jan 13, 1986
Sold by
Haygood Garnetta P
Bought by
Haygood Dennis J
Purchase Details
Closed on
Nov 16, 1984
Sold by
White Mary L
Bought by
Haygood Garnetta P
Purchase Details
Closed on
Jan 1, 1975
Bought by
White Mary L
Create a Home Valuation Report for This Property
The Home Valuation Report is an in-depth analysis detailing your home's value as well as a comparison with similar homes in the area
Home Values in the Area
Average Home Value in this Area
Purchase History
| Date | Buyer | Sale Price | Title Company |
|---|---|---|---|
| Washington Investment Company Llc | $8,000 | Trid Cappital Title | |
| Third Federal Savings And Loan Asset Of | $8,000 | None Available | |
| Fortson James V | $35,000 | -- | |
| Haygood Dennis J | -- | -- | |
| Haygood Garnetta P | $25,000 | -- | |
| White Mary L | -- | -- |
Source: Public Records
Mortgage History
| Date | Status | Borrower | Loan Amount |
|---|---|---|---|
| Previous Owner | Fortson James V | $31,150 |
Source: Public Records
Tax History Compared to Growth
Tax History
| Year | Tax Paid | Tax Assessment Tax Assessment Total Assessment is a certain percentage of the fair market value that is determined by local assessors to be the total taxable value of land and additions on the property. | Land | Improvement |
|---|---|---|---|---|
| 2024 | $2,136 | $22,015 | $4,550 | $17,465 |
| 2023 | $1,600 | $13,520 | $3,330 | $10,190 |
| 2022 | $1,042 | $13,510 | $3,330 | $10,190 |
| 2021 | $1,032 | $13,510 | $3,330 | $10,190 |
| 2020 | $1,030 | $11,660 | $2,870 | $8,790 |
| 2019 | $1,353 | $33,300 | $8,200 | $25,100 |
| 2018 | $951 | $11,660 | $2,870 | $8,790 |
| 2017 | $1,015 | $12,010 | $2,700 | $9,310 |
| 2016 | $983 | $12,010 | $2,700 | $9,310 |
| 2015 | $1,162 | $12,010 | $2,700 | $9,310 |
| 2014 | $1,162 | $14,150 | $3,190 | $10,960 |
Source: Public Records
Map
Nearby Homes
- 3792 E 149th St
- 3786 E 151st St
- 3778 E 146th St
- 3846 E 146th St
- 3833 E 144th St
- 3698 E 153rd St
- 3894 E 147th St
- 3661 E 146th St
- 3664 E 153rd St
- 14914 Glendale Ave
- 3885 E 153rd St
- 3872 E 154th St
- 3633 E 147th St
- 3722 E 143rd St
- 3846 E 143rd St
- 3863 E 154th St
- 3628 E 151st St
- 3935 E 147th St
- 3698 E 143rd St
- 15618 Scottsdale Blvd
- 3760 E 149th St
- 3752 E 149th St
- 3764 E 149th St
- 3768 E 149th St
- 3772 E 149th St
- 3755 E 149th St
- 3755 E 147th St
- 3761 E 147th St
- 3751 E 147th St
- 3763 E 149th St
- 3763 E 147th St
- 3776 E 149th St
- 3767 E 149th St
- 3741 E 147th St
- 3771 E 149th St
- 3771 E 147th St
- 3734 E 149th St
- 14909 Bartlett Ave
- 3780 E 149th St
- 3751 E 149th St