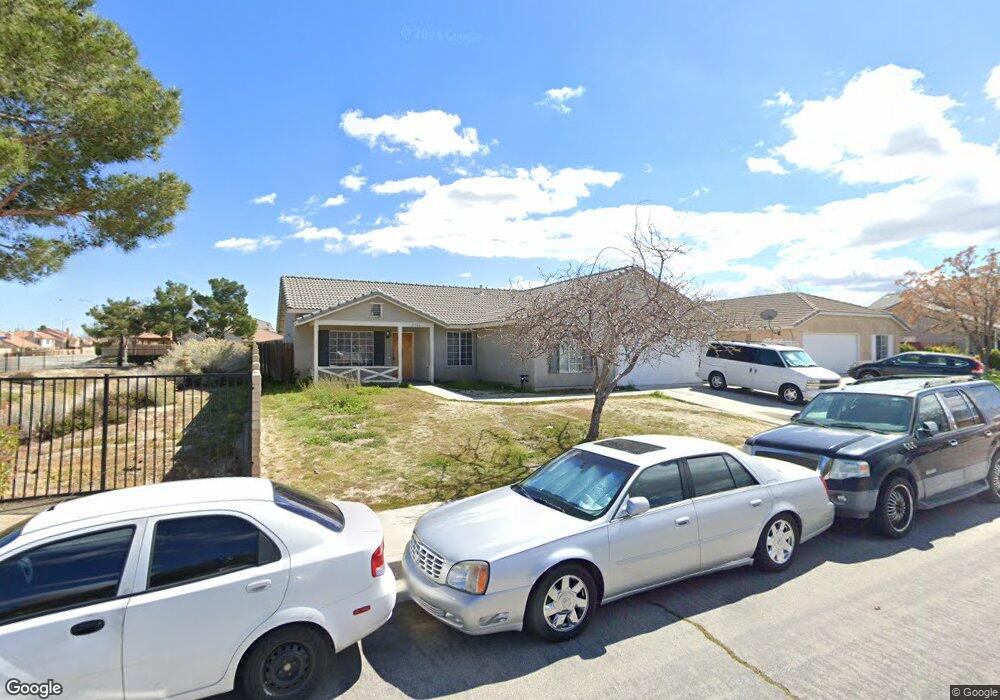
37566 56th St E Palmdale, CA 93552
East Palmdale NeighborhoodEstimated Value: $462,814 - $487,000
4
Beds
2
Baths
1,755
Sq Ft
$272/Sq Ft
Est. Value
About This Home
This home is located at 37566 56th St E, Palmdale, CA 93552 and is currently estimated at $478,204, approximately $272 per square foot. 37566 56th St E is a home located in Los Angeles County with nearby schools including Quail Valley Elementary School, Shadow Hills Middle School, and Knight High School.
Ownership History
Date
Name
Owned For
Owner Type
Purchase Details
Closed on
Aug 21, 1997
Sold by
West Venture
Bought by
Charles Yolanda
Current Estimated Value
Home Financials for this Owner
Home Financials are based on the most recent Mortgage that was taken out on this home.
Original Mortgage
$110,174
Outstanding Balance
$16,514
Interest Rate
7.54%
Mortgage Type
FHA
Estimated Equity
$461,690
Purchase Details
Closed on
Mar 25, 1997
Sold by
Resurgence Properties Inc
Bought by
West Venture
Purchase Details
Closed on
Mar 31, 1994
Sold by
Lomas Mtg Usa Inc
Bought by
Resurgence Properties Inc
Home Financials for this Owner
Home Financials are based on the most recent Mortgage that was taken out on this home.
Original Mortgage
$83,127,841
Interest Rate
7.59%
Purchase Details
Closed on
Feb 18, 1994
Sold by
Stan Shaw Corp
Bought by
Lomas Mtg Usa Inc
Home Financials for this Owner
Home Financials are based on the most recent Mortgage that was taken out on this home.
Original Mortgage
$83,127,841
Interest Rate
7.59%
Create a Home Valuation Report for This Property
The Home Valuation Report is an in-depth analysis detailing your home's value as well as a comparison with similar homes in the area
Home Values in the Area
Average Home Value in this Area
Purchase History
| Date | Buyer | Sale Price | Title Company |
|---|---|---|---|
| Charles Yolanda | $111,500 | Lawyers Title Company | |
| West Venture | $167,500 | Continental Lawyers Title Co | |
| Resurgence Properties Inc | -- | -- | |
| Lomas Mtg Usa Inc | $2,142,608 | Stewart Title |
Source: Public Records
Mortgage History
| Date | Status | Borrower | Loan Amount |
|---|---|---|---|
| Open | Charles Yolanda | $110,174 | |
| Previous Owner | Resurgence Properties Inc | $83,127,841 |
Source: Public Records
Tax History
| Year | Tax Paid | Tax Assessment Tax Assessment Total Assessment is a certain percentage of the fair market value that is determined by local assessors to be the total taxable value of land and additions on the property. | Land | Improvement |
|---|---|---|---|---|
| 2025 | $4,010 | $177,208 | $35,430 | $141,778 |
| 2024 | $4,010 | $173,735 | $34,736 | $138,999 |
| 2023 | $3,971 | $170,329 | $34,055 | $136,274 |
| 2022 | $3,839 | $166,990 | $33,388 | $133,602 |
| 2021 | $3,751 | $163,717 | $32,734 | $130,983 |
| 2019 | $3,639 | $158,863 | $31,764 | $127,099 |
| 2018 | $3,583 | $155,749 | $31,142 | $124,607 |
| 2016 | $3,368 | $149,703 | $29,934 | $119,769 |
| 2015 | $3,332 | $147,455 | $29,485 | $117,970 |
| 2014 | $3,293 | $144,568 | $28,908 | $115,660 |
Source: Public Records
Map
Nearby Homes
- 5642 Lighthouse Ln
- 5522 Lighthouse Ln
- 5602 E Avenue r11
- 5390 Karling Place
- 5389 Evergem Ave
- 5361 Karling Place
- 5805 Lighthouse Ln
- 37538 Sabal Ct
- 5851 Evergem Ave
- 37334 55th St E
- 5246 Karling Place
- 5564 Capri Ct
- 37519 Hudson St
- 37833 Tackstem St
- 0 E Nearby E Ave L6 75th St E Unit SR26035422
- 0 Vic Ave R Vic 80th Ste Unit NP26040378
- 0 E Ave M Drt Vic 73rd St E Unit SR25077456
- 52 Vic Avenue T12 Vic
- 0 E Avenue P9 78th Unit HD24130262
- 0 Vac Ave L8 Vic 83rd Ste Unit SR24056261
- 37558 56th St E
- 37565 Deville St
- 37559 Deville St
- 37552 56th St E
- 5559 Katrina Place
- 37551 Deville St
- 37557 56th St E
- 37544 56th St E
- 5553 Katrina Place
- 37551 56th St E
- 37543 Deville St
- 5629 Katrina Place
- 5630 Katrina Place
- 5552 Katrina Place
- 37543 56th St E
- 5547 Katrina Place
- 37538 56th St E
- 37537 Deville St
- 5635 Katrina Place
- 5629 Diamond St
Your Personal Tour Guide
Ask me questions while you tour the home.