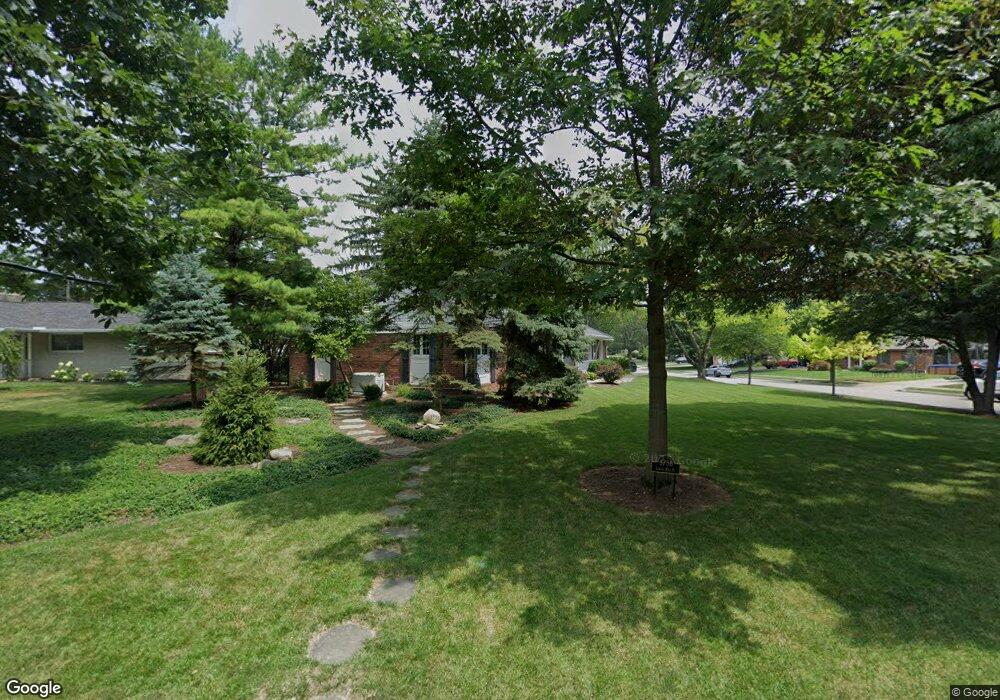
3758 Surrey Hill Place Columbus, OH 43220
Estimated Value: $610,000 - $643,000
3
Beds
2
Baths
2,014
Sq Ft
$311/Sq Ft
Est. Value
About This Home
This home is located at 3758 Surrey Hill Place, Columbus, OH 43220 and is currently estimated at $625,384, approximately $310 per square foot. 3758 Surrey Hill Place is a home located in Franklin County with nearby schools including Windermere Elementary School, Hastings Middle School, and Upper Arlington High School.
Ownership History
Date
Name
Owned For
Owner Type
Purchase Details
Closed on
Feb 8, 2007
Sold by
Cooper Jill E
Bought by
Kriska S David and Kriska Cheryl V
Current Estimated Value
Home Financials for this Owner
Home Financials are based on the most recent Mortgage that was taken out on this home.
Original Mortgage
$192,000
Outstanding Balance
$115,447
Interest Rate
6.23%
Mortgage Type
Purchase Money Mortgage
Estimated Equity
$509,937
Purchase Details
Closed on
Aug 12, 2005
Sold by
Drumheller Robert J and Drumheller Mary M
Bought by
Cooper Jill E
Home Financials for this Owner
Home Financials are based on the most recent Mortgage that was taken out on this home.
Original Mortgage
$230,400
Interest Rate
6.25%
Mortgage Type
Fannie Mae Freddie Mac
Purchase Details
Closed on
Oct 2, 1991
Bought by
Drumheller Robert J
Create a Home Valuation Report for This Property
The Home Valuation Report is an in-depth analysis detailing your home's value as well as a comparison with similar homes in the area
Home Values in the Area
Average Home Value in this Area
Purchase History
| Date | Buyer | Sale Price | Title Company |
|---|---|---|---|
| Kriska S David | $285,000 | Chicago Tit | |
| Cooper Jill E | $258,500 | Chicago Tit | |
| Drumheller Robert J | $190,000 | -- |
Source: Public Records
Mortgage History
| Date | Status | Borrower | Loan Amount |
|---|---|---|---|
| Open | Kriska S David | $192,000 | |
| Closed | Cooper Jill E | $230,400 |
Source: Public Records
Tax History Compared to Growth
Tax History
| Year | Tax Paid | Tax Assessment Tax Assessment Total Assessment is a certain percentage of the fair market value that is determined by local assessors to be the total taxable value of land and additions on the property. | Land | Improvement |
|---|---|---|---|---|
| 2024 | $9,842 | $179,800 | $76,720 | $103,080 |
| 2023 | $9,756 | $179,795 | $76,720 | $103,075 |
| 2022 | $9,086 | $138,780 | $54,950 | $83,830 |
| 2021 | $8,043 | $138,780 | $54,950 | $83,830 |
| 2020 | $7,972 | $138,780 | $54,950 | $83,830 |
| 2019 | $7,626 | $118,720 | $54,950 | $63,770 |
| 2018 | $6,956 | $119,350 | $54,950 | $64,400 |
| 2017 | $6,951 | $119,350 | $54,950 | $64,400 |
| 2016 | $6,291 | $103,890 | $35,530 | $68,360 |
| 2015 | $6,285 | $103,890 | $35,530 | $68,360 |
| 2014 | $6,292 | $103,890 | $35,530 | $68,360 |
| 2013 | $2,977 | $94,430 | $32,305 | $62,125 |
Source: Public Records
Map
Nearby Homes
- 2276 Hoxton Ct
- 2300 Hoxton Ct
- 2276 Johnston Rd
- 3918 Hillview Dr
- 2195 Edgevale Rd
- 2413 Edgevale Rd
- 3804 Mountview Rd
- 2081 Fishinger Rd
- 2308 Shrewsbury Rd
- 3920 Overdale Dr
- 2401 Shrewsbury Rd
- 2443 Shrewsbury Rd
- 2424 Nottingham Rd
- 3509 Redding Rd
- 2162 Oakmount Rd
- 3701 Reed Rd
- 4115 Woodbridge Rd
- 2565 Nottingham Rd
- 2680 Bristol Rd
- 2666 Shrewsbury Rd
- 3770 Surrey Hill Place
- 3751 Walhaven Rd
- 2261 Glenmere Rd
- 3765 Walhaven Rd
- 3782 Surrey Hill Place
- 2241 Glenmere Rd
- 3757 Surrey Hill Place
- 3720 Surrey Hill Place
- 3777 Walhaven Rd
- 3781 Surrey Hill Place
- 3729 Surrey Hill Place
- 2231 Glenmere Rd
- 3794 Surrey Hill Place
- 3795 Surrey Hill Place
- 3710 Surrey Hill Place
- 2220 Glenmere Rd
- 2250 Shoreham Rd
- 3762 Walhaven Rd
- 2221 Glenmere Rd
- 3808 Surrey Hill Place