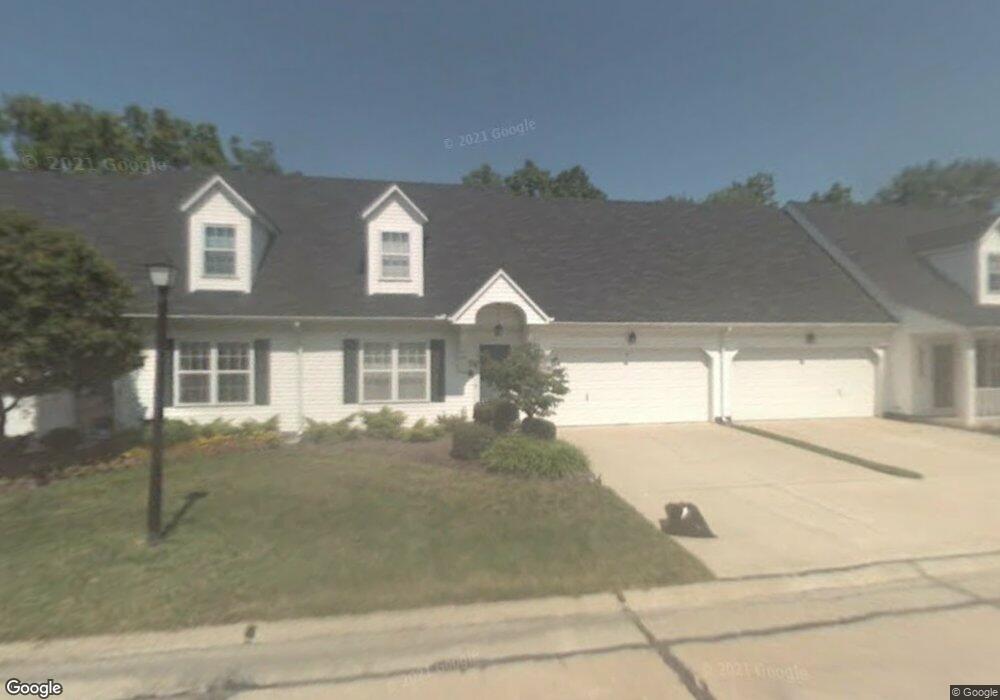
37587 Ocean Reef Unit 7565-D Willoughby, OH 44094
Estimated Value: $230,239 - $237,000
2
Beds
2
Baths
1,332
Sq Ft
$175/Sq Ft
Est. Value
About This Home
This home is located at 37587 Ocean Reef Unit 7565-D, Willoughby, OH 44094 and is currently estimated at $233,560, approximately $175 per square foot. 37587 Ocean Reef Unit 7565-D is a home located in Lake County with nearby schools including Grant Elementary School, Willoughby Middle School, and South High School.
Ownership History
Date
Name
Owned For
Owner Type
Purchase Details
Closed on
May 18, 2020
Sold by
Chase Julia
Bought by
Floran Michael Patrick
Current Estimated Value
Home Financials for this Owner
Home Financials are based on the most recent Mortgage that was taken out on this home.
Original Mortgage
$132,100
Outstanding Balance
$117,059
Interest Rate
3.3%
Mortgage Type
New Conventional
Estimated Equity
$116,501
Purchase Details
Closed on
Sep 13, 2018
Sold by
Scaminace Joseph
Bought by
Chase Julia
Home Financials for this Owner
Home Financials are based on the most recent Mortgage that was taken out on this home.
Original Mortgage
$100,000
Interest Rate
4.5%
Mortgage Type
New Conventional
Purchase Details
Closed on
Sep 18, 2013
Sold by
Kerecman Beverly and The Estate Of Mary Fujimoto
Bought by
Scaminace Joseph
Purchase Details
Closed on
Nov 20, 1992
Bought by
Fujimoto Mary
Create a Home Valuation Report for This Property
The Home Valuation Report is an in-depth analysis detailing your home's value as well as a comparison with similar homes in the area
Home Values in the Area
Average Home Value in this Area
Purchase History
| Date | Buyer | Sale Price | Title Company |
|---|---|---|---|
| Floran Michael Patrick | $158,000 | None Available | |
| Chase Julia | $139,900 | Stewart Title | |
| Scaminace Joseph | $102,500 | Stewart Title | |
| Fujimoto Mary | $92,900 | -- |
Source: Public Records
Mortgage History
| Date | Status | Borrower | Loan Amount |
|---|---|---|---|
| Open | Floran Michael Patrick | $132,100 | |
| Previous Owner | Chase Julia | $100,000 |
Source: Public Records
Tax History Compared to Growth
Tax History
| Year | Tax Paid | Tax Assessment Tax Assessment Total Assessment is a certain percentage of the fair market value that is determined by local assessors to be the total taxable value of land and additions on the property. | Land | Improvement |
|---|---|---|---|---|
| 2024 | -- | $62,460 | $15,120 | $47,340 |
| 2023 | $4,705 | $49,690 | $12,080 | $37,610 |
| 2022 | $3,063 | $49,690 | $12,080 | $37,610 |
| 2021 | $3,077 | $49,690 | $12,080 | $37,610 |
| 2020 | $3,001 | $43,210 | $10,500 | $32,710 |
| 2019 | $2,785 | $43,210 | $10,500 | $32,710 |
| 2018 | $2,813 | $38,630 | $680 | $37,950 |
| 2017 | $2,677 | $38,630 | $680 | $37,950 |
| 2016 | $2,667 | $38,630 | $680 | $37,950 |
| 2015 | $2,579 | $38,630 | $680 | $37,950 |
| 2014 | $2,453 | $38,630 | $680 | $37,950 |
| 2013 | $2,386 | $38,630 | $680 | $37,950 |
Source: Public Records
Map
Nearby Homes
- 37584 Ocean Reef
- 3680 Foothill Blvd
- 38125 Highgate Bluff Ln
- VL Foothill Blvd
- 36765 Garretts Cove Dr
- 36843 Stevens Blvd
- 1057 Valley Creek Dr
- 35931 Woodland Dr
- 3780 E 364th St
- 38220 Westminster Ln
- 38610 Wood Rd
- 3000 Steve Guard Ct
- 36842 Saint Clair St
- 847 Audrey Dr
- 2687 Westminster Ln
- 1270 E 362nd St
- 38063 Euclid Ave
- 1222 E 360th St
- 2962 Flossy Ct
- 35821 Meyer Ave
- 37587 Ocean Reef
- 37575 Ocean Reef
- 37599 Ocean Reef
- 37563 Ocean Reef
- 37611 Ocean Reef
- 37551 Ocean Reef
- 37572 Ocean Reef
- 37560 Ocean Reef Unit 37560C
- 37619 Ocean Reef
- 37611 Sturbridge Ln
- 37548 Ocean Reef Unit 37560D
- 37599 Sturbridge Ln
- 37539 Ocean Reef Unit 37539
- 37587 Sturbridge Ln Unit 37575A
- 37536 Ocean Reef
- 37536 Ocean Reef Unit B-26
- 37635 Ocean Reef Unit 37635C
- 37527 Ocean Reef Unit 37527C
- 37575 Sturbridge Ln
- 37563 Sturbridge Ln