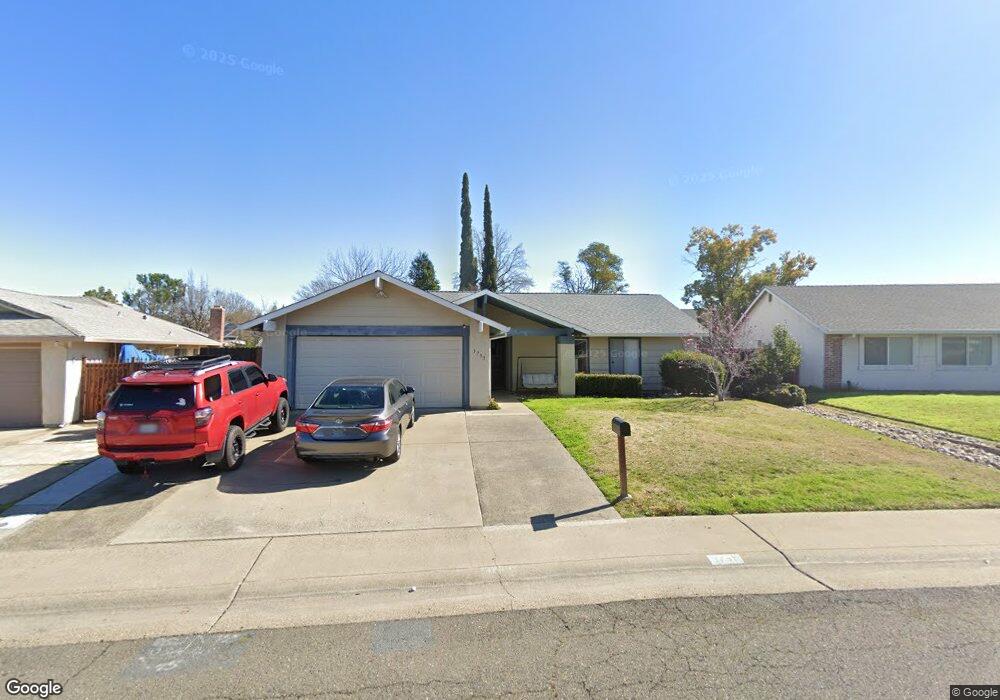
3759 Station St Sacramento, CA 95827
Rosemont NeighborhoodEstimated Value: $403,656 - $443,000
3
Beds
2
Baths
1,230
Sq Ft
$348/Sq Ft
Est. Value
About This Home
This home is located at 3759 Station St, Sacramento, CA 95827 and is currently estimated at $428,164, approximately $348 per square foot. 3759 Station St is a home located in Sacramento County with nearby schools including James Marshall Elementary School, Albert Einstein Middle School, and Rosemont High School.
Ownership History
Date
Name
Owned For
Owner Type
Purchase Details
Closed on
Apr 28, 2006
Sold by
Pouncey Marilyn and Pouncey Darryl
Bought by
Pouncey Darryl and Pouncey Marilyn
Current Estimated Value
Home Financials for this Owner
Home Financials are based on the most recent Mortgage that was taken out on this home.
Original Mortgage
$26,500
Outstanding Balance
$15,251
Interest Rate
6.29%
Mortgage Type
New Conventional
Estimated Equity
$412,913
Purchase Details
Closed on
Jul 17, 2003
Sold by
Pouncey Marilyn and Sullivan Marilyn D
Bought by
Pouncey Darryl and Pouncey Marilyn
Home Financials for this Owner
Home Financials are based on the most recent Mortgage that was taken out on this home.
Original Mortgage
$120,560
Outstanding Balance
$53,875
Interest Rate
5.94%
Mortgage Type
Purchase Money Mortgage
Estimated Equity
$374,289
Purchase Details
Closed on
Apr 2, 1999
Sold by
Mercier J Randall and Mercier Angel O
Bought by
Sullivan Marilyn D
Home Financials for this Owner
Home Financials are based on the most recent Mortgage that was taken out on this home.
Original Mortgage
$95,400
Interest Rate
6.91%
Create a Home Valuation Report for This Property
The Home Valuation Report is an in-depth analysis detailing your home's value as well as a comparison with similar homes in the area
Home Values in the Area
Average Home Value in this Area
Purchase History
| Date | Buyer | Sale Price | Title Company |
|---|---|---|---|
| Pouncey Darryl | -- | Liberty Title Company | |
| Pouncey Darryl | -- | North American Title Co | |
| Sullivan Marilyn D | $106,000 | Financial Title Company |
Source: Public Records
Mortgage History
| Date | Status | Borrower | Loan Amount |
|---|---|---|---|
| Open | Pouncey Darryl | $26,500 | |
| Open | Pouncey Darryl | $120,560 | |
| Closed | Sullivan Marilyn D | $95,400 |
Source: Public Records
Tax History Compared to Growth
Tax History
| Year | Tax Paid | Tax Assessment Tax Assessment Total Assessment is a certain percentage of the fair market value that is determined by local assessors to be the total taxable value of land and additions on the property. | Land | Improvement |
|---|---|---|---|---|
| 2025 | $1,997 | $166,152 | $54,857 | $111,295 |
| 2024 | $1,997 | $162,895 | $53,782 | $109,113 |
| 2023 | $1,950 | $159,702 | $52,728 | $106,974 |
| 2022 | $1,916 | $156,572 | $51,695 | $104,877 |
| 2021 | $1,825 | $153,503 | $50,682 | $102,821 |
| 2020 | $1,840 | $151,930 | $50,163 | $101,767 |
| 2019 | $1,800 | $148,952 | $49,180 | $99,772 |
| 2018 | $1,753 | $146,032 | $48,216 | $97,816 |
| 2017 | $1,728 | $143,170 | $47,271 | $95,899 |
| 2016 | $1,653 | $140,364 | $46,345 | $94,019 |
| 2015 | $1,629 | $138,256 | $45,649 | $92,607 |
| 2014 | $1,584 | $135,548 | $44,755 | $90,793 |
Source: Public Records
Map
Nearby Homes
- 3812 Moonbeam Dr
- 3839 Moonbeam Dr
- 0 Helio Dr
- 3622 Gold Creek Ln
- 3620 Gold Creek Ln
- 3652 Pullman Dr
- 3606 Gold Creek Ln
- 9421 Williamette Way
- 9436 Bravo Way
- Plan 1923 at Stone Creek Village - Veranda
- Plan 1542 at Stone Creek Village - Veranda
- Plan 1684 at Stone Creek Village - Veranda
- Plan 1452 at Stone Creek Village - Veranda
- 9380 Mirandy Dr
- 9372 Snowbird Way
- 9547 Achates Cir
- 3983 Avante Way
- 9404 Achates Cir
- Plan 1644 at Westcott Station
- Plan 1755 Modeled at Westcott Station
- 3755 Station St
- 3758 Rock Island Dr
- 3756 Rock Island Dr
- 3762 Rock Island Dr
- 3751 Station St
- 3767 Station St
- 3752 Rock Island Dr
- 3758 Station St
- 3764 Station St
- 3752 Station St
- 3766 Rock Island Dr
- 3748 Rock Island Dr
- 3771 Station St
- 3745 Station St
- 3770 Station St
- 3770 Rock Island Dr
- 9540 Signal Ct
- 3744 Station St
- 9533 Brakeman Ct
- 3744 Rock Island Dr