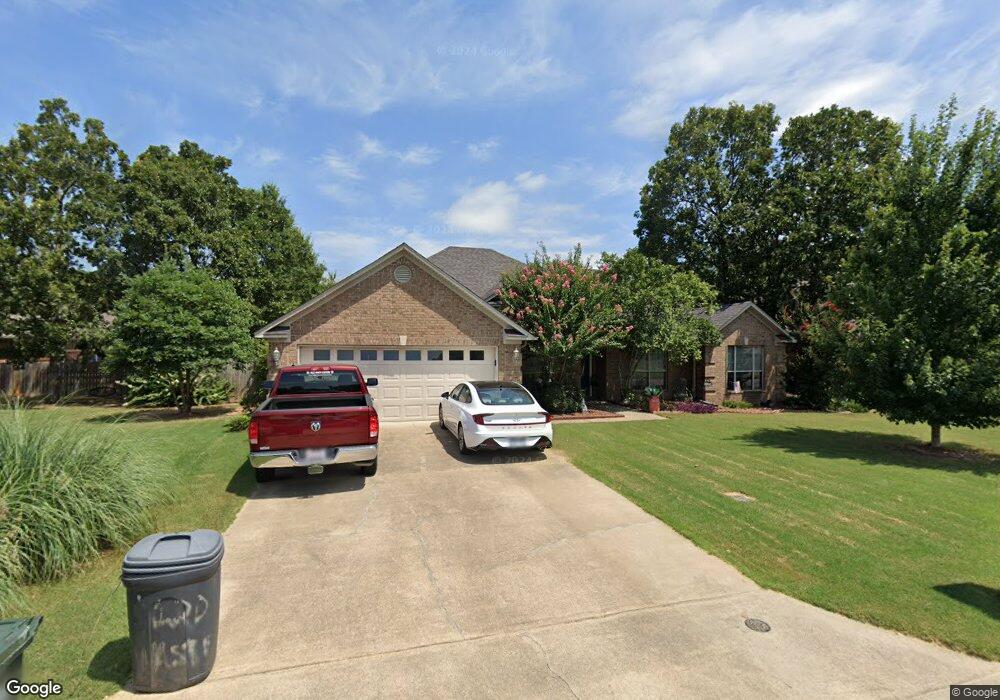
3760 Irby Dr Conway, AR 72034
Downtown Conway NeighborhoodEstimated Value: $332,103 - $394,000
Studio
2
Baths
2,225
Sq Ft
$158/Sq Ft
Est. Value
About This Home
This home is located at 3760 Irby Dr, Conway, AR 72034 and is currently estimated at $351,526, approximately $157 per square foot. 3760 Irby Dr is a home located in Faulkner County with nearby schools including Jim Stone Elementary School, Conway Junior High School, and Carl Stuart Middle School.
Ownership History
Date
Name
Owned For
Owner Type
Purchase Details
Closed on
May 4, 2024
Sold by
Speck Thomas H and Speck Kelly J
Bought by
Speck Thomas H and Speck Kelly J
Current Estimated Value
Home Financials for this Owner
Home Financials are based on the most recent Mortgage that was taken out on this home.
Original Mortgage
$284,400
Outstanding Balance
$279,541
Interest Rate
6.79%
Mortgage Type
VA
Estimated Equity
$71,985
Purchase Details
Closed on
Aug 31, 2023
Sold by
Speck Thomas H
Bought by
Thomas And Kelly Speck Revocable Trust and Speck
Purchase Details
Closed on
Dec 9, 2013
Sold by
Speck Thomas H and Speck Kelly J
Bought by
Speck Thomas H
Home Financials for this Owner
Home Financials are based on the most recent Mortgage that was taken out on this home.
Original Mortgage
$153,250
Interest Rate
4.36%
Mortgage Type
VA
Purchase Details
Closed on
Sep 5, 2003
Bought by
Speck
Purchase Details
Closed on
May 9, 2002
Bought by
Moncrief
Create a Home Valuation Report for This Property
The Home Valuation Report is an in-depth analysis detailing your home's value as well as a comparison with similar homes in the area
Home Values in the Area
Average Home Value in this Area
Purchase History
| Date | Buyer | Sale Price | Title Company |
|---|---|---|---|
| Speck Thomas H | -- | None Listed On Document | |
| Thomas And Kelly Speck Revocable Trust | -- | None Listed On Document | |
| Speck Thomas H | -- | None Available | |
| Speck | $172,000 | -- | |
| Denise | -- | -- | |
| Moncrief | $167,000 | -- |
Source: Public Records
Mortgage History
| Date | Status | Borrower | Loan Amount |
|---|---|---|---|
| Open | Speck Thomas H | $284,400 | |
| Previous Owner | Speck Thomas H | $153,250 |
Source: Public Records
Tax History
| Year | Tax Paid | Tax Assessment Tax Assessment Total Assessment is a certain percentage of the fair market value that is determined by local assessors to be the total taxable value of land and additions on the property. | Land | Improvement |
|---|---|---|---|---|
| 2025 | $2,385 | $61,540 | $7,200 | $54,340 |
| 2024 | $2,277 | $61,540 | $7,200 | $54,340 |
| 2023 | $2,169 | $46,860 | $7,200 | $39,660 |
| 2022 | $1,700 | $46,860 | $7,200 | $39,660 |
| 2021 | $1,605 | $46,860 | $7,200 | $39,660 |
| 2020 | $1,511 | $37,280 | $7,200 | $30,080 |
| 2019 | $1,511 | $37,280 | $7,200 | $30,080 |
| 2018 | $1,536 | $37,280 | $7,200 | $30,080 |
| 2017 | $1,536 | $37,280 | $7,200 | $30,080 |
| 2016 | $1,536 | $37,280 | $7,200 | $30,080 |
| 2015 | $1,965 | $38,830 | $6,000 | $32,830 |
| 2014 | $1,615 | $38,830 | $6,000 | $32,830 |
Source: Public Records
Map
Nearby Homes
- 3805 Irby Dr
- 3720 Monarch Cove
- 3615 Heidi Ct
- 1635 Poteete Dr
- 3525 Juniper Dr
- 3630 Aspen Cir
- 940 Doy B Rd
- 3 New Oxford Rd
- 4505 Sawgrass Cove
- 950 Doy B Rd
- 960 Doy B Rd
- 1760 Centennial Club Dr
- 3335 Nicklaus Dr
- 4325 Gazebo Dr
- 4335 Gazebo Dr
- 4655 Palm Springs Cir
- 1320 Nob Hill St
- 1330 Nob Hill St
- 1224 Turnberry Dr
- 1655 Chicot Dr
- 3750 Irby Dr
- 3800 Irby Dr
- 3740 Irby Dr
- 3815 Newcastle Dr
- 3755 Irby Dr
- 3825 Newcastle Dr
- 3805 Newcastle Dr
- 3730 Irby Dr
- 3735 Newcastle Dr
- 1935 Poteete Dr
- 3735 Irby Dr
- 3820 Irby Dr
- 1990 Penny Or 3815 Irby
- 1990 Penny St
- 1990 Penny St
- 3905 Newcastle Dr
- 1930 Poteete Dr
- 0 Poteete Dr Unit 20026784
- 0 Poteete Dr Unit 20023666
- 0 Poteete Dr Unit 20020149
Your Personal Tour Guide
Ask me questions while you tour the home.