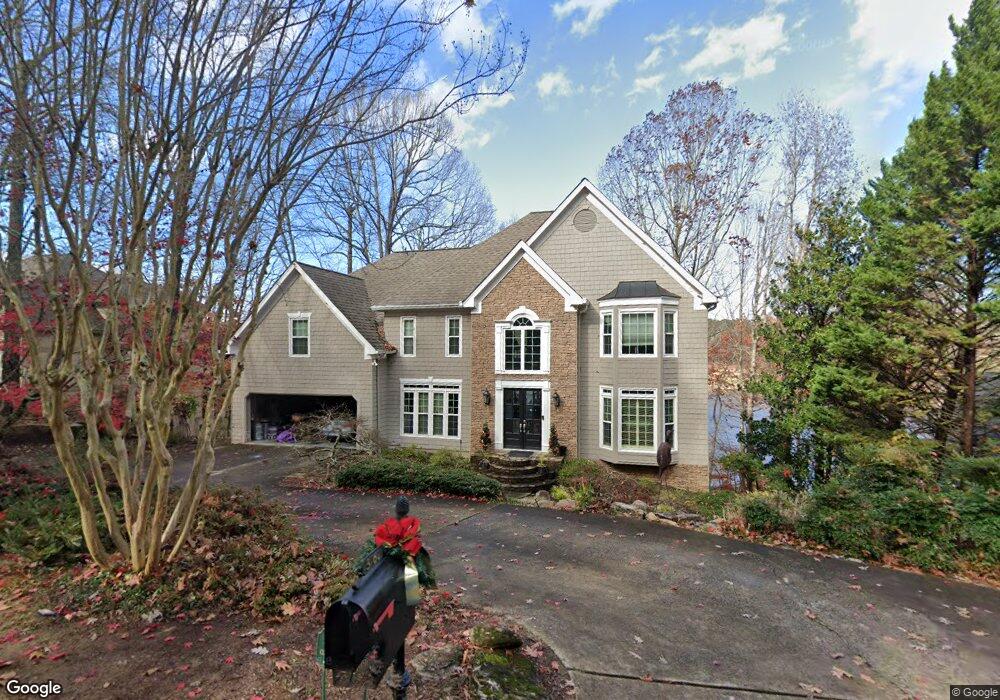
3760 Schooner Ridge Alpharetta, GA 30005
Windward NeighborhoodEstimated Value: $1,116,000 - $1,339,000
5
Beds
5
Baths
3,902
Sq Ft
$319/Sq Ft
Est. Value
About This Home
This home is located at 3760 Schooner Ridge, Alpharetta, GA 30005 and is currently estimated at $1,245,211, approximately $319 per square foot. 3760 Schooner Ridge is a home located in Fulton County with nearby schools including Lake Windward Elementary School, Webb Bridge Middle School, and Alpharetta High School.
Ownership History
Date
Name
Owned For
Owner Type
Purchase Details
Closed on
Jul 6, 2004
Sold by
Denny David M and Denny Joann
Bought by
Selinger Debra M
Current Estimated Value
Purchase Details
Closed on
Jan 13, 1998
Sold by
Walters Stanley P and Walters Kathleen
Bought by
Denny David M and Denny Joann K
Home Financials for this Owner
Home Financials are based on the most recent Mortgage that was taken out on this home.
Original Mortgage
$456,000
Interest Rate
7.07%
Mortgage Type
New Conventional
Purchase Details
Closed on
Dec 7, 1993
Sold by
Wright John W Diane M
Bought by
Huser Lawrence R Mary E
Home Financials for this Owner
Home Financials are based on the most recent Mortgage that was taken out on this home.
Original Mortgage
$200,000
Interest Rate
6.85%
Create a Home Valuation Report for This Property
The Home Valuation Report is an in-depth analysis detailing your home's value as well as a comparison with similar homes in the area
Home Values in the Area
Average Home Value in this Area
Purchase History
| Date | Buyer | Sale Price | Title Company |
|---|---|---|---|
| Selinger Debra M | $635,000 | -- | |
| Denny David M | $570,000 | -- | |
| Huser Lawrence R Mary E | $450,000 | -- |
Source: Public Records
Mortgage History
| Date | Status | Borrower | Loan Amount |
|---|---|---|---|
| Previous Owner | Denny David M | $456,000 | |
| Previous Owner | Huser Lawrence R Mary E | $200,000 |
Source: Public Records
Tax History Compared to Growth
Tax History
| Year | Tax Paid | Tax Assessment Tax Assessment Total Assessment is a certain percentage of the fair market value that is determined by local assessors to be the total taxable value of land and additions on the property. | Land | Improvement |
|---|---|---|---|---|
| 2025 | $1,833 | $466,120 | $166,640 | $299,480 |
| 2023 | $13,157 | $466,120 | $166,640 | $299,480 |
| 2022 | $7,538 | $338,600 | $97,680 | $240,920 |
| 2021 | $9,104 | $328,760 | $94,840 | $233,920 |
| 2020 | $9,007 | $304,000 | $70,040 | $233,960 |
| 2019 | $1,554 | $304,000 | $70,040 | $233,960 |
| 2018 | $7,446 | $349,600 | $70,040 | $279,560 |
| 2017 | $7,656 | $291,640 | $44,320 | $247,320 |
| 2016 | $7,622 | $291,640 | $44,320 | $247,320 |
| 2015 | $9,127 | $291,640 | $44,320 | $247,320 |
| 2014 | $7,399 | $265,400 | $40,320 | $225,080 |
Source: Public Records
Map
Nearby Homes
- 1075 Carnoustie Ln
- 1315 Portmarnock Dr
- 2250 Blackheath Trace
- 410 Fox Chase Cir
- 2800 Lakewind Ct
- 1200 Bay Pointe Terrace
- 1225 Bay Pointe Terrace
- 10 Club Ct
- 520 Flying Scot Way
- 1895 Oak Tree Hollow
- 2120 Blackheath Trace
- 5200 Cresslyn Ridge
- 1125 Lake Shore Overlook
- 6000 Greatwood Terrace
- 11835 Leeward Walk Cir
- 4440 Webb Bridge Rd
- 1140 Park Glenn Dr
- 6105 Harbour Overlook
- 2195 Lake Shore Landing
- 3770 Schooner Ridge
- 3750 Schooner Ridge
- 3780 Schooner Ridge
- 3740 Schooner Ridge
- 3995 Schooner Ridge
- 4005 Schooner Ridge
- 3975 Schooner Ridge
- 4015 Schooner Ridge
- 3965 Schooner Ridge
- 3790 Schooner Ridge
- 3730 Schooner Ridge
- 3955 Schooner Ridge
- 4025 Schooner Ridge
- 3945 Schooner Ridge
- 3720 Schooner Ridge
- 4010 Schooner Ridge
- 4000 Schooner Ridge
- 4020 Schooner Ridge
- 4035 Schooner Ridge
- 4030 Schooner Ridge