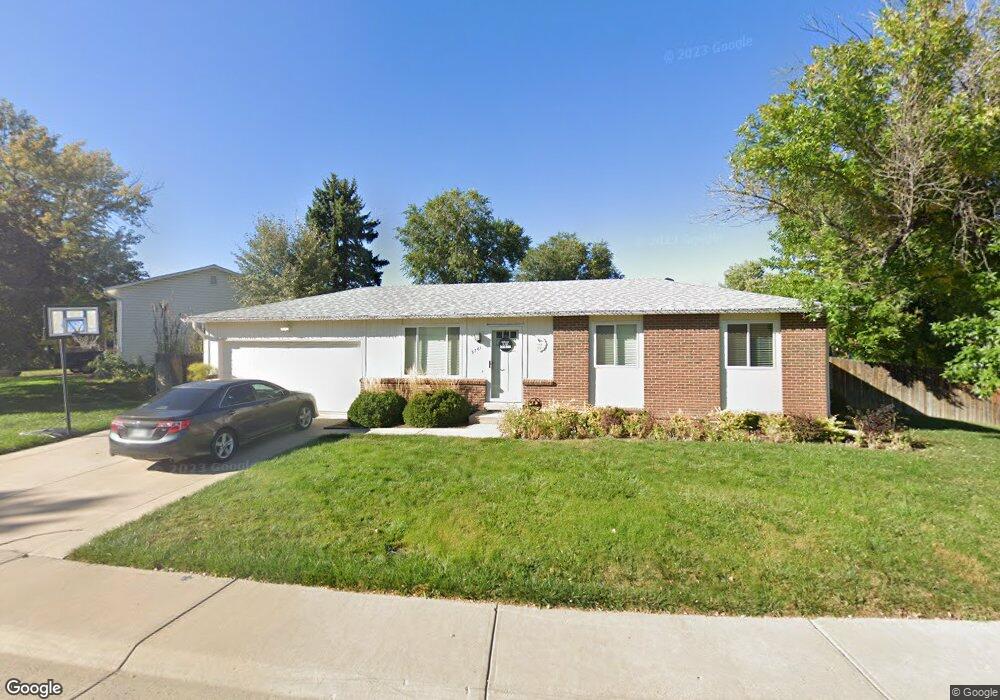
3761 E 117th Ave Thornton, CO 80233
Woodglen NeighborhoodEstimated Value: $414,830 - $465,000
4
Beds
2
Baths
850
Sq Ft
$523/Sq Ft
Est. Value
About This Home
This home is located at 3761 E 117th Ave, Thornton, CO 80233 and is currently estimated at $444,708, approximately $523 per square foot. 3761 E 117th Ave is a home located in Adams County with nearby schools including Woodglen Elementary School, Century Middle School, and Mountain Range High School.
Ownership History
Date
Name
Owned For
Owner Type
Purchase Details
Closed on
Aug 20, 2007
Sold by
Hud
Bought by
Morton John Jason and Morton Angela Marilyn
Current Estimated Value
Home Financials for this Owner
Home Financials are based on the most recent Mortgage that was taken out on this home.
Original Mortgage
$158,604
Outstanding Balance
$98,712
Interest Rate
6.69%
Mortgage Type
Unknown
Estimated Equity
$345,996
Purchase Details
Closed on
Jun 4, 2007
Sold by
Martin James T
Bought by
Secretary Of Hud
Purchase Details
Closed on
May 27, 2005
Sold by
Clements Douglas L and Clements Douglas Lee
Bought by
Martin James T
Home Financials for this Owner
Home Financials are based on the most recent Mortgage that was taken out on this home.
Original Mortgage
$191,298
Interest Rate
5.83%
Mortgage Type
FHA
Purchase Details
Closed on
Feb 4, 2004
Sold by
Clements Douglas L and Clements Mary Shannon
Bought by
Clements Douglas L
Purchase Details
Closed on
May 16, 1996
Sold by
Clements Douglas L
Bought by
Clements Douglas L and Clements Mary Shannon
Create a Home Valuation Report for This Property
The Home Valuation Report is an in-depth analysis detailing your home's value as well as a comparison with similar homes in the area
Home Values in the Area
Average Home Value in this Area
Purchase History
| Date | Buyer | Sale Price | Title Company |
|---|---|---|---|
| Morton John Jason | $158,604 | Wtg | |
| Secretary Of Hud | -- | None Available | |
| Martin James T | $194,000 | Land Title Guarantee Company | |
| Clements Douglas L | -- | -- | |
| Clements Douglas L | -- | -- |
Source: Public Records
Mortgage History
| Date | Status | Borrower | Loan Amount |
|---|---|---|---|
| Open | Morton John Jason | $158,604 | |
| Previous Owner | Martin James T | $191,298 |
Source: Public Records
Tax History
| Year | Tax Paid | Tax Assessment Tax Assessment Total Assessment is a certain percentage of the fair market value that is determined by local assessors to be the total taxable value of land and additions on the property. | Land | Improvement |
|---|---|---|---|---|
| 2025 | $2,746 | $28,900 | $6,600 | $22,300 |
| 2024 | $2,746 | $26,560 | $6,060 | $20,500 |
| 2023 | $2,718 | $30,240 | $6,090 | $24,150 |
| 2022 | $2,499 | $22,690 | $6,050 | $16,640 |
| 2021 | $2,581 | $22,690 | $6,050 | $16,640 |
| 2020 | $2,557 | $22,920 | $6,220 | $16,700 |
| 2019 | $2,562 | $22,920 | $6,220 | $16,700 |
| 2018 | $2,139 | $18,590 | $5,760 | $12,830 |
| 2017 | $1,945 | $18,590 | $5,760 | $12,830 |
| 2016 | $1,539 | $14,320 | $3,180 | $11,140 |
| 2015 | $1,537 | $14,320 | $3,180 | $11,140 |
| 2014 | -- | $12,840 | $2,710 | $10,130 |
Source: Public Records
Map
Nearby Homes
- 11867 Jackson Cir
- 4160 E 119th Place Unit B
- 11731 Ash St
- 11909 Monroe St
- 3491 E 119th St
- 4220 E 119th Place Unit B
- 4145 E 119th Place Unit B
- 11776 Saint Paul St
- 4319 E 118th Ave
- 11961 Bellaire St Unit C
- 11981 Bellaire St Unit D
- 4402 E 117th Ct
- 3422 E 114th Dr
- 11323 Albion St
- 2656 E 117th Way
- 11510 Milwaukee St
- 3991 E 121st Ave
- 4875 E 117th Dr
- 11529 Clayton St
- 5005 E 117th Ave
- 3741 E 117th Ave
- 11711 Jackson St
- 3801 E 117th Ave
- 11720 Garfield St
- 3701 E 117th Ave
- 11721 Jackson St
- 3760 E 117th Ave
- 11730 Garfield St
- 3800 E 117th Ave
- 3720 E 117th Ave
- 3740 E 117th Ave
- 3821 E 117th Ave
- 11740 Garfield St
- 3700 E 117th Ave
- 11731 Jackson St
- 3799 Woodglen Blvd
- 11730 Jackson St
- 3820 E 117th Ave
- 3791 Woodglen Blvd
- 3801 Woodglen Blvd
Your Personal Tour Guide
Ask me questions while you tour the home.