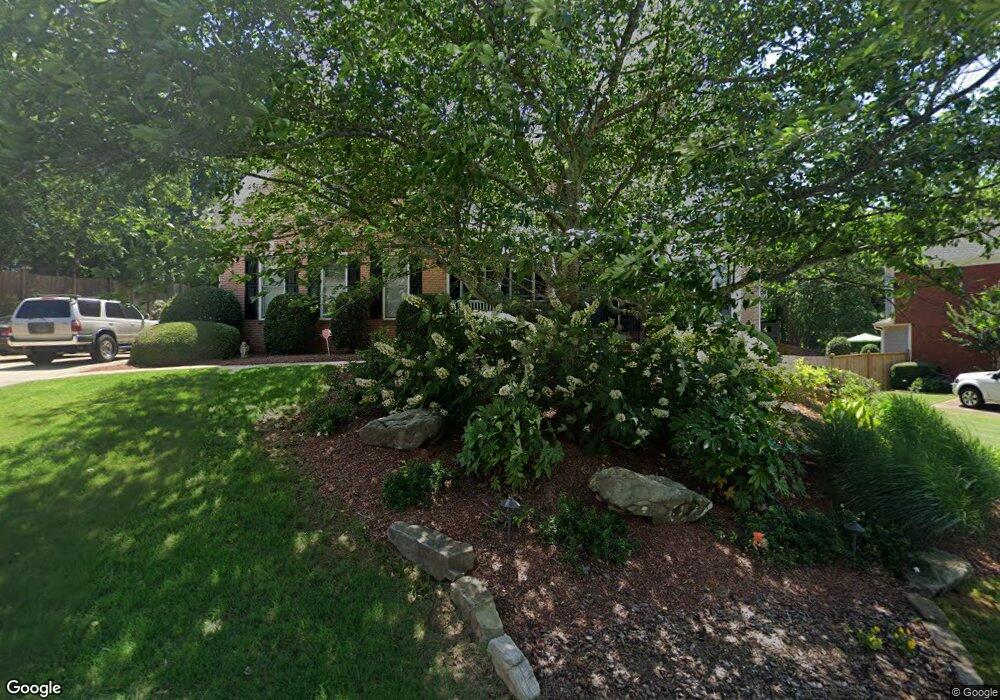
3763 Honey Pot Way NE Marietta, GA 30066
Sandy Plains NeighborhoodEstimated Value: $679,000 - $752,000
4
Beds
5
Baths
3,587
Sq Ft
$200/Sq Ft
Est. Value
About This Home
This home is located at 3763 Honey Pot Way NE, Marietta, GA 30066 and is currently estimated at $718,000, approximately $200 per square foot. 3763 Honey Pot Way NE is a home located in Cobb County with nearby schools including Keheley Elementary School and McCleskey Middle School.
Ownership History
Date
Name
Owned For
Owner Type
Purchase Details
Closed on
Oct 8, 2024
Sold by
Dean Gerry D
Bought by
Mitchell Venita R
Current Estimated Value
Purchase Details
Closed on
Jun 7, 2002
Sold by
Allison Keith M
Bought by
Newcomb Annette W
Home Financials for this Owner
Home Financials are based on the most recent Mortgage that was taken out on this home.
Original Mortgage
$308,720
Interest Rate
9.63%
Mortgage Type
New Conventional
Purchase Details
Closed on
Dec 14, 2000
Sold by
Robert Harris Homes Inc
Bought by
Allison Keith M
Home Financials for this Owner
Home Financials are based on the most recent Mortgage that was taken out on this home.
Original Mortgage
$300,800
Interest Rate
7.81%
Mortgage Type
New Conventional
Create a Home Valuation Report for This Property
The Home Valuation Report is an in-depth analysis detailing your home's value as well as a comparison with similar homes in the area
Home Values in the Area
Average Home Value in this Area
Purchase History
| Date | Buyer | Sale Price | Title Company |
|---|---|---|---|
| Mitchell Venita R | -- | None Listed On Document | |
| Mitchell Venita R | -- | None Listed On Document | |
| Newcomb Annette W | $385,900 | -- | |
| Allison Keith M | $376,000 | -- |
Source: Public Records
Mortgage History
| Date | Status | Borrower | Loan Amount |
|---|---|---|---|
| Previous Owner | Newcomb Annette W | $308,720 | |
| Previous Owner | Allison Keith M | $300,800 |
Source: Public Records
Tax History Compared to Growth
Tax History
| Year | Tax Paid | Tax Assessment Tax Assessment Total Assessment is a certain percentage of the fair market value that is determined by local assessors to be the total taxable value of land and additions on the property. | Land | Improvement |
|---|---|---|---|---|
| 2025 | $8,347 | $277,040 | $56,000 | $221,040 |
| 2024 | $8,010 | $265,668 | $56,000 | $209,668 |
| 2023 | $6,803 | $225,636 | $46,000 | $179,636 |
| 2022 | $6,848 | $225,636 | $46,000 | $179,636 |
| 2021 | $5,546 | $182,720 | $42,000 | $140,720 |
| 2020 | $5,546 | $182,720 | $42,000 | $140,720 |
| 2019 | $5,254 | $173,100 | $42,000 | $131,100 |
| 2018 | $4,935 | $162,608 | $42,000 | $120,608 |
| 2017 | $4,675 | $162,608 | $42,000 | $120,608 |
| 2016 | $4,675 | $162,608 | $42,000 | $120,608 |
| 2015 | $4,242 | $143,980 | $42,000 | $101,980 |
| 2014 | $4,278 | $143,980 | $0 | $0 |
Source: Public Records
Map
Nearby Homes
- 3816 Havenrock Dr
- 3812 Havenrock Dr
- 2124 Lassiter Field Dr NE
- 3844 Havenrock
- 3835 Rockhaven Ct
- 3851 Trickum Rd NE
- 4056 Longford Dr NE
- 4050 Idlewilde Meadows Dr NE
- 1984 Credence Ct NE
- 3634 Stonehenge Way NE
- 3663 Heatherwood Dr NE
- 2578 Middle Coray Cir
- 2402 Woodbridge Dr
- 1849 Service Dr NE
- 2477 Bobbie Dr
- 2610 Chadwick Rd
- 3287 Allegheny Dr
- 2603 Chadwick Rd
- 1718 Christie Dr NE
- 3765 Honey Pot Way NE
- 2121 Tigger Trace NE Unit 2
- 3762 Honey Pot Way NE
- 3929 Blustery Way NE
- 0 Tigger Trace NE
- 3917 Blustery Way NE
- 2119 Tigger Trace NE
- 3760 Honey Pot Way NE
- 3933 Blustery Way NE
- 3758 Honey Pot Way NE
- 3928 Blustery Way NE
- 2120 Tigger Trace NE
- 3913 Blustery Way NE Unit 1
- 2122 Tigger Trace NE
- 3756 Honey Pot Way NE
- 3937 Blustery Way NE
- 3920 Blustery Way NE
- 3909 Blustery Way NE Unit 1
- 3951 Trickum Rd NE
- 3932 Blustery Way NE