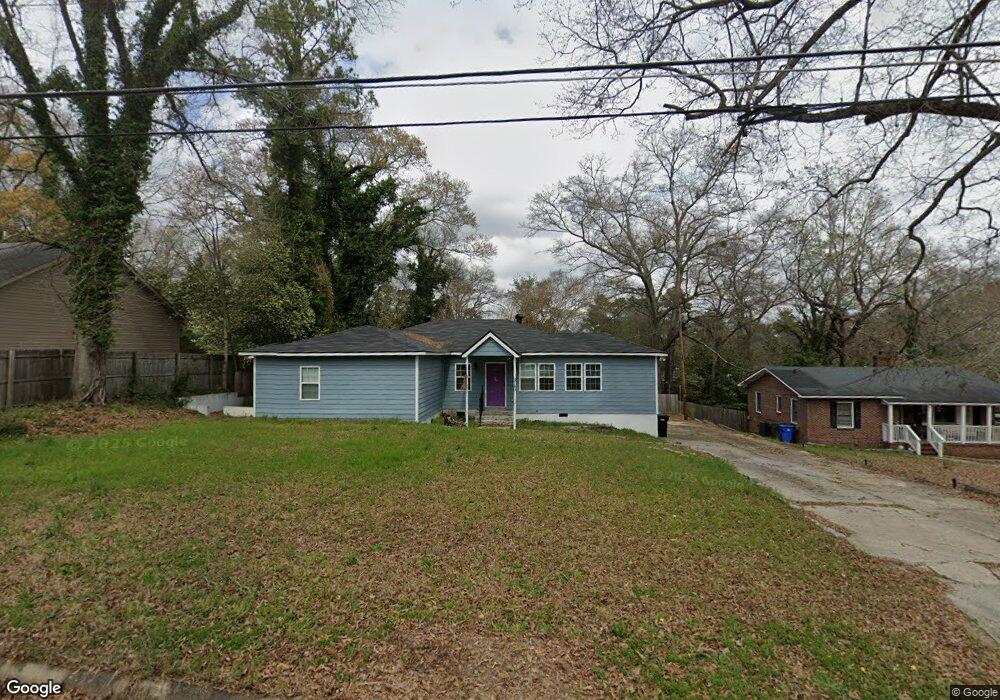
3763 Mulberry Dr Columbus, GA 31907
Eastern Columbus NeighborhoodEstimated Value: $183,000 - $262,000
4
Beds
4
Baths
2,138
Sq Ft
$102/Sq Ft
Est. Value
About This Home
This home is located at 3763 Mulberry Dr, Columbus, GA 31907 and is currently estimated at $218,977, approximately $102 per square foot. 3763 Mulberry Dr is a home located in Muscogee County with nearby schools including Rigdon Road Elementary School, Richards Middle School, and Hardaway High School.
Ownership History
Date
Name
Owned For
Owner Type
Purchase Details
Closed on
May 26, 2023
Sold by
Scheanon Phillip Michael
Bought by
Smedes Jenna Brianne
Current Estimated Value
Home Financials for this Owner
Home Financials are based on the most recent Mortgage that was taken out on this home.
Original Mortgage
$218,500
Outstanding Balance
$212,657
Interest Rate
6.39%
Mortgage Type
New Conventional
Estimated Equity
$6,320
Purchase Details
Closed on
Apr 29, 2020
Sold by
Kessling Chad
Bought by
Scheanon Phillip Michael
Home Financials for this Owner
Home Financials are based on the most recent Mortgage that was taken out on this home.
Original Mortgage
$189,255
Interest Rate
3.3%
Purchase Details
Closed on
Sep 13, 2019
Sold by
G & M Kennon Properties Lllp
Bought by
Kessling Chad and Kessling Laura
Purchase Details
Closed on
Aug 2, 2011
Sold by
Hassell Charles C
Bought by
G & M Kennon Properties Lllp
Create a Home Valuation Report for This Property
The Home Valuation Report is an in-depth analysis detailing your home's value as well as a comparison with similar homes in the area
Home Values in the Area
Average Home Value in this Area
Purchase History
| Date | Buyer | Sale Price | Title Company |
|---|---|---|---|
| Smedes Jenna Brianne | $230,000 | None Listed On Document | |
| Scheanon Phillip Michael | $185,000 | -- | |
| Kessling Chad | $39,500 | -- | |
| G & M Kennon Properties Lllp | $27,558 | -- |
Source: Public Records
Mortgage History
| Date | Status | Borrower | Loan Amount |
|---|---|---|---|
| Open | Smedes Jenna Brianne | $218,500 | |
| Previous Owner | Scheanon Phillip Michael | $189,255 |
Source: Public Records
Tax History Compared to Growth
Tax History
| Year | Tax Paid | Tax Assessment Tax Assessment Total Assessment is a certain percentage of the fair market value that is determined by local assessors to be the total taxable value of land and additions on the property. | Land | Improvement |
|---|---|---|---|---|
| 2025 | $3,601 | $92,000 | $9,880 | $82,120 |
| 2024 | $3,601 | $92,000 | $9,880 | $82,120 |
| 2023 | $3,589 | $91,108 | $9,988 | $81,120 |
| 2022 | $2,945 | $72,128 | $7,496 | $64,632 |
| 2021 | $2,948 | $72,196 | $7,496 | $64,700 |
| 2020 | $645 | $15,800 | $3,320 | $12,480 |
| 2019 | $1,022 | $24,936 | $5,620 | $19,316 |
| 2018 | $1,022 | $24,936 | $5,620 | $19,316 |
| 2017 | $1,025 | $24,936 | $5,620 | $19,316 |
| 2016 | $1,155 | $28,000 | $2,312 | $25,688 |
| 2015 | $983 | $28,000 | $2,312 | $25,688 |
| 2014 | $1,158 | $28,000 | $2,312 | $25,688 |
| 2013 | -- | $34,794 | $2,312 | $32,482 |
Source: Public Records
Map
Nearby Homes
- 3760 Mulberry Dr
- 8 Kingswood Ct
- 2 Kingswood Ct
- 3800 Woodmont Dr
- 3836 Mulberry Dr
- 3875 Mulberry Dr
- 4 Clausen Dr
- 1554 Holland Ave
- 3562 Woodland Dr
- 3560 Woodland Dr
- 1459 Alta Vista Dr
- 1553 Violet Ave
- 1618 Forestside Dr
- 1674 Forestside Dr
- 4201 Forrest Rd
- 1433 Kevin Ct
- 2525 Norris Rd Unit 36
- 2525 Norris Rd Unit 91
- 4161 Althea Dr
- 4160 Spirea Dr
- 3771 Mulberry Dr
- 3755 Mulberry Dr
- 1901 Dunwoody Dr
- 3805 Mulberry Dr
- 1905 Dunwoody Dr
- 3751 Mulberry Dr
- 3813 Mulberry Dr
- 1900 Dunwoody Dr
- 1911 Dunwoody Dr
- 3747 Mulberry Dr
- 3748 Mulberry Dr
- 3770 Mulberry Dr
- 3819 Mulberry Dr
- 1902 Dunwoody Dr
- 1919 Dunwoody Dr
- 1906 Dunwoody Dr
- 3742 Mulberry Dr
- 3737 Mulberry Dr
- 1912 Dunwoody Dr
- 3831 Mulberry Dr