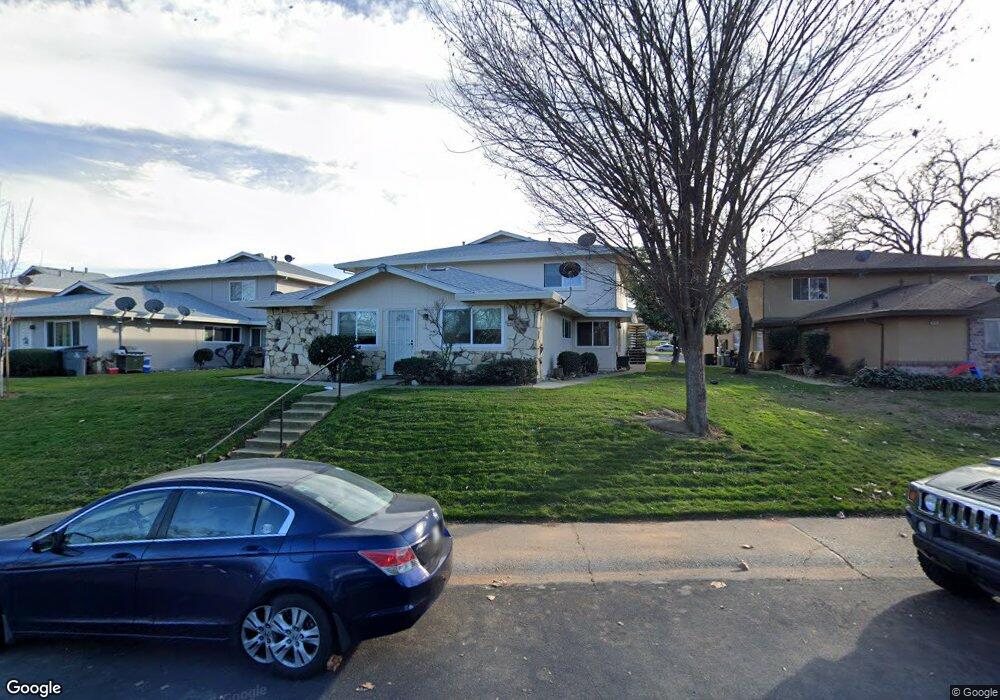
3763 Park Dr Unit 1 Auburn, CA 95602
Northwest Auburn NeighborhoodEstimated Value: $201,000 - $214,000
2
Beds
1
Bath
803
Sq Ft
$259/Sq Ft
Est. Value
About This Home
This home is located at 3763 Park Dr Unit 1, Auburn, CA 95602 and is currently estimated at $207,582, approximately $258 per square foot. 3763 Park Dr Unit 1 is a home located in Placer County with nearby schools including Placer High School, EV Cain Middle, and St. Joseph Catholic School.
Ownership History
Date
Name
Owned For
Owner Type
Purchase Details
Closed on
Dec 16, 2015
Sold by
Starnes Eric and Eric Starnes Trust
Bought by
Pensco Trust Company and Susan D Thompson Ira
Current Estimated Value
Purchase Details
Closed on
Nov 17, 2011
Sold by
Maxion David and Maxion Chong
Bought by
Starnes Eric and Eric Starnes Trust
Purchase Details
Closed on
Jun 15, 2009
Sold by
Maxion David and Maxion Chong
Bought by
Maxion David W and Maxion Chong W
Purchase Details
Closed on
Jul 13, 2004
Sold by
Rockman Maxion Mary
Bought by
Maxion David and Maxion Chong
Home Financials for this Owner
Home Financials are based on the most recent Mortgage that was taken out on this home.
Original Mortgage
$68,700
Interest Rate
6.27%
Mortgage Type
New Conventional
Purchase Details
Closed on
Sep 21, 2000
Sold by
Middleton Kathleen E and Middleton Kathleen E
Bought by
Rockman Maxion Mary
Create a Home Valuation Report for This Property
The Home Valuation Report is an in-depth analysis detailing your home's value as well as a comparison with similar homes in the area
Home Values in the Area
Average Home Value in this Area
Purchase History
| Date | Buyer | Sale Price | Title Company |
|---|---|---|---|
| Pensco Trust Company | $75,000 | Old Republic Title Company | |
| Starnes Eric | $41,500 | None Available | |
| Maxion David W | -- | None Available | |
| Maxion David | $125,000 | North American Title | |
| Rockman Maxion Mary | $58,500 | First American Title Ins Co |
Source: Public Records
Mortgage History
| Date | Status | Borrower | Loan Amount |
|---|---|---|---|
| Previous Owner | Maxion David | $68,700 | |
| Closed | Maxion David | $63,250 |
Source: Public Records
Tax History Compared to Growth
Tax History
| Year | Tax Paid | Tax Assessment Tax Assessment Total Assessment is a certain percentage of the fair market value that is determined by local assessors to be the total taxable value of land and additions on the property. | Land | Improvement |
|---|---|---|---|---|
| 2025 | $3,136 | $206,935 | $10,612 | $196,323 |
| 2023 | $3,136 | $198,900 | $10,200 | $188,700 |
| 2022 | $1,788 | $83,660 | $27,886 | $55,774 |
| 2021 | $1,755 | $82,021 | $27,340 | $54,681 |
| 2020 | $1,749 | $81,181 | $27,060 | $54,121 |
| 2019 | $1,732 | $79,590 | $26,530 | $53,060 |
| 2018 | $1,686 | $78,030 | $26,010 | $52,020 |
| 2017 | $1,671 | $76,500 | $25,500 | $51,000 |
| 2016 | $1,654 | $75,000 | $25,000 | $50,000 |
| 2015 | $1,509 | $61,474 | $20,491 | $40,983 |
| 2014 | $1,500 | $60,271 | $20,090 | $40,181 |
Source: Public Records
Map
Nearby Homes
- 3677 Galena Dr Unit 3
- 3643 Galena Dr Unit 4
- 3765 Grass Valley Hwy Unit 282
- 3765 Grass Valley Hwy Unit 263
- 3765 Grass Valley Hwy Unit 14
- 3765 Grass Valley Hwy Unit 117
- 3765 Grass Valley Hwy Unit 226
- 11632 Quartz Dr Unit 4
- 11582 Quartz Dr Unit 3
- 11521 Garnet Way Unit 2
- 11510 Garnet Way Unit 4
- 11670 Garnet Way Unit 4
- 3277 Professional Dr
- 3222 Fortune Ct
- 11441 White Doe Ct
- 11325 Tahoe St
- 11614 Sherwood Way
- 0 Bell Rd Unit 225114567
- 11290 Dry Creek Rd
- 11761 Graeagle Ln
- 3763 Park Dr Unit 3
- 3763 Park Dr
- 3763 Park Dr Unit 2
- 3763 Park Dr Unit 1
- 3763 Park Dr Unit 4
- 3773 Park Dr Unit 3
- 3773 Park Dr Unit 2A
- 3773 Park Dr Unit 1
- 3773 Park Dr Unit 2
- 3773 Park Dr Unit 4
- 3783 Park Dr Unit 4
- 3783 Park Dr
- 3783 Park Dr Unit 1
- 3783 Park Dr
- 3793 Park Dr Unit 1
- 3793 Park Dr Unit 3
- 3793 Park Dr
- 3793 Park Dr
- 3793 Park Dr Unit 4
- 3753 Park Dr Unit 4