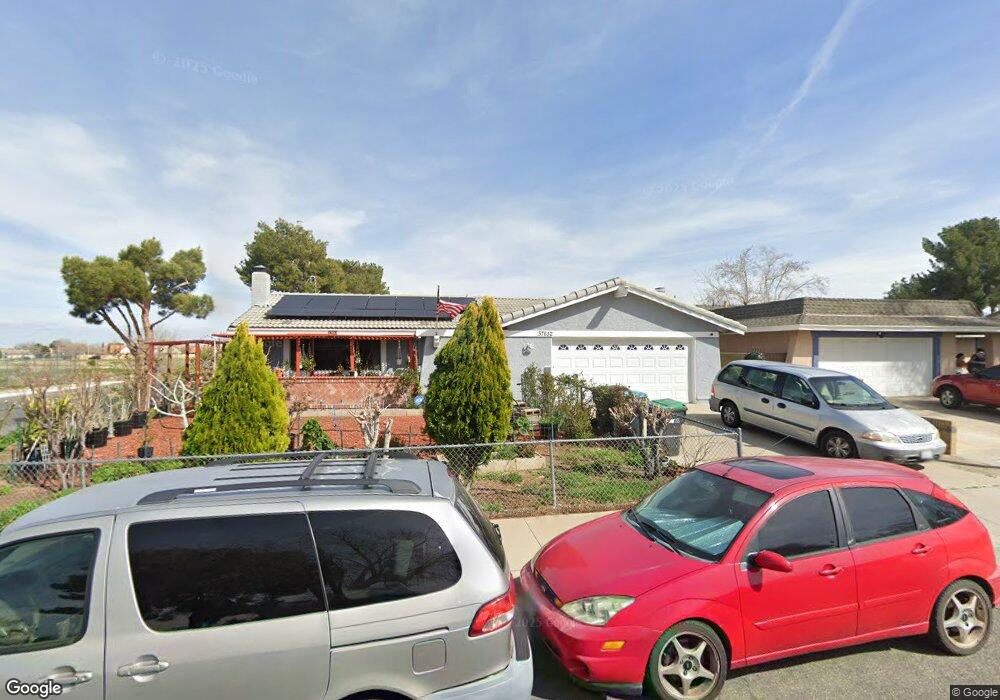
37652 28th St E Palmdale, CA 93550
East Palmdale NeighborhoodEstimated Value: $415,741 - $448,000
3
Beds
2
Baths
1,359
Sq Ft
$317/Sq Ft
Est. Value
About This Home
This home is located at 37652 28th St E, Palmdale, CA 93550 and is currently estimated at $430,935, approximately $317 per square foot. 37652 28th St E is a home located in Los Angeles County with nearby schools including Desert Rose Elementary School, Cactus Magnet Academy, and Palmdale High School.
Ownership History
Date
Name
Owned For
Owner Type
Purchase Details
Closed on
Sep 28, 2011
Sold by
Gunawan Widianto and Sari Yati
Bought by
Gilmore Ayn
Current Estimated Value
Home Financials for this Owner
Home Financials are based on the most recent Mortgage that was taken out on this home.
Original Mortgage
$100,000
Outstanding Balance
$67,907
Interest Rate
4.01%
Mortgage Type
Purchase Money Mortgage
Estimated Equity
$363,028
Purchase Details
Closed on
Sep 9, 2010
Sold by
Rajendra Jayantha and Dang Diana
Bought by
Gunawan Widianto and Sari Yati
Purchase Details
Closed on
Mar 24, 2006
Sold by
Owen Ronnie Lee and Owen Kathleen Louise
Bought by
Rajendra Jayantha
Home Financials for this Owner
Home Financials are based on the most recent Mortgage that was taken out on this home.
Original Mortgage
$272,000
Interest Rate
7.74%
Mortgage Type
Purchase Money Mortgage
Create a Home Valuation Report for This Property
The Home Valuation Report is an in-depth analysis detailing your home's value as well as a comparison with similar homes in the area
Home Values in the Area
Average Home Value in this Area
Purchase History
| Date | Buyer | Sale Price | Title Company |
|---|---|---|---|
| Gilmore Ayn | $100,000 | Calcounties Title Nation | |
| Gunawan Widianto | $102,000 | Calcounties Title Nation | |
| Rajendra Jayantha | $339,000 | Fidelity National Title |
Source: Public Records
Mortgage History
| Date | Status | Borrower | Loan Amount |
|---|---|---|---|
| Open | Gilmore Ayn | $100,000 | |
| Previous Owner | Rajendra Jayantha | $272,000 |
Source: Public Records
Tax History
| Year | Tax Paid | Tax Assessment Tax Assessment Total Assessment is a certain percentage of the fair market value that is determined by local assessors to be the total taxable value of land and additions on the property. | Land | Improvement |
|---|---|---|---|---|
| 2025 | $2,451 | $125,592 | $25,114 | $100,478 |
| 2024 | $2,451 | $123,130 | $24,622 | $98,508 |
| 2023 | $2,434 | $120,717 | $24,140 | $96,577 |
| 2022 | $2,350 | $118,351 | $23,667 | $94,684 |
| 2021 | $2,291 | $116,031 | $23,203 | $92,828 |
| 2019 | $2,231 | $112,592 | $22,516 | $90,076 |
| 2018 | $2,199 | $110,385 | $22,075 | $88,310 |
| 2016 | $2,064 | $106,101 | $21,219 | $84,882 |
| 2015 | $2,042 | $104,508 | $20,901 | $83,607 |
| 2014 | $2,023 | $102,462 | $20,492 | $81,970 |
Source: Public Records
Map
Nearby Homes
- 37633 29th St E
- 28th Ste Vic Avenue R8
- 37551 29th St E
- Vac/ 26th Ste Vic Ave #R8
- 0 Vac 30th St E
- 26 Ste Vic Ave
- 2906 Casamia Ave
- 0 Avenue R4 30th St E Unit 24007965
- 37841 Rudall Ave
- 2535 E Avenue R-3
- 2560 E Avenue r12
- 0 Cor 25th Ste Ave R12 Ave Unit 26001723
- 0 28th St E
- 3110 Viana Dr
- 37337 26th St E
- 37623 Robin Ln
- 3063 Marbella Ln
- 3108 E Avenue r4
- 0 26th St E Unit SR25268352
- 2309 Gregory Ave
- 37646 28th St E
- 37657 29th St E
- 37651 29th St E
- 37640 28th St E
- 37647 29th St E
- 37653 28th St E
- 37643 29th St E
- 37647 28th St E
- 37634 28th St E
- 37639 29th St E
- 37641 28th St E
- 37656 29th St E
- 37650 29th St E
- 37635 28th St E
- 37628 28th St E
- 37646 29th St E
- 37650 Dalzell St
- 37644 Dalzell St
- 37642 29th St E
- 37629 29th St E
Your Personal Tour Guide
Ask me questions while you tour the home.