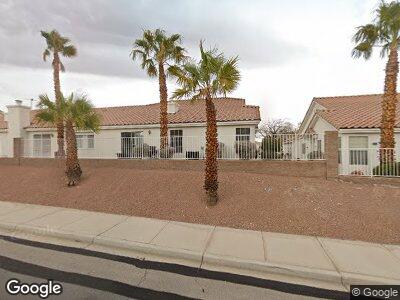
3769 Cape Solitude St Las Vegas, NV 89147
Rancho Viejo NeighborhoodEstimated Value: $328,260 - $388,000
3
Beds
2
Baths
1,457
Sq Ft
$247/Sq Ft
Est. Value
About This Home
This home is located at 3769 Cape Solitude St, Las Vegas, NV 89147 and is currently estimated at $359,565, approximately $246 per square foot. 3769 Cape Solitude St is a home located in Clark County with nearby schools including Keith C & Karen W Hayes Elementary School, Victoria Fertitta Middle School, and Spring Valley High School.
Ownership History
Date
Name
Owned For
Owner Type
Purchase Details
Closed on
Oct 24, 2003
Sold by
Declues Debra Mouton
Bought by
Ganier Warren and Ganier Cheryl
Current Estimated Value
Home Financials for this Owner
Home Financials are based on the most recent Mortgage that was taken out on this home.
Original Mortgage
$124,600
Interest Rate
4.62%
Mortgage Type
Unknown
Purchase Details
Closed on
May 3, 2000
Sold by
Vallas Robert S
Bought by
Declues Debra Mouton and Debra M Declues Family Trust
Purchase Details
Closed on
Feb 29, 2000
Sold by
Declues Debra M
Bought by
Declues Debra Mouton and Debra M Declues Family Trust
Purchase Details
Closed on
Dec 30, 1998
Sold by
Antelope Canyon Llc
Bought by
Vallas Robert S and Declues Debra M
Home Financials for this Owner
Home Financials are based on the most recent Mortgage that was taken out on this home.
Original Mortgage
$100,000
Interest Rate
6.82%
Mortgage Type
Purchase Money Mortgage
Create a Home Valuation Report for This Property
The Home Valuation Report is an in-depth analysis detailing your home's value as well as a comparison with similar homes in the area
Home Values in the Area
Average Home Value in this Area
Purchase History
| Date | Buyer | Sale Price | Title Company |
|---|---|---|---|
| Ganier Warren | $174,600 | Nevada Title Company | |
| Declues Debra Mouton | -- | -- | |
| Declues Debra Mouton | -- | -- | |
| Vallas Robert S | $123,000 | Nevada Title Company |
Source: Public Records
Mortgage History
| Date | Status | Borrower | Loan Amount |
|---|---|---|---|
| Open | Ganier Warren | $104,000 | |
| Closed | Ganier Warren | $124,600 | |
| Previous Owner | Vallas Robert S | $100,000 |
Source: Public Records
Tax History Compared to Growth
Tax History
| Year | Tax Paid | Tax Assessment Tax Assessment Total Assessment is a certain percentage of the fair market value that is determined by local assessors to be the total taxable value of land and additions on the property. | Land | Improvement |
|---|---|---|---|---|
| 2025 | $1,595 | $89,239 | $32,550 | $56,689 |
| 2024 | $1,549 | $89,239 | $32,550 | $56,689 |
| 2023 | $1,549 | $79,947 | $28,000 | $51,947 |
| 2022 | $1,504 | $72,417 | $23,100 | $49,317 |
| 2021 | $1,460 | $61,331 | $21,000 | $40,331 |
| 2020 | $1,415 | $62,467 | $20,300 | $42,167 |
| 2019 | $1,374 | $60,077 | $18,200 | $41,877 |
| 2018 | $1,334 | $54,503 | $14,350 | $40,153 |
| 2017 | $1,549 | $52,094 | $12,600 | $39,494 |
| 2016 | $1,264 | $50,968 | $10,500 | $40,468 |
| 2015 | $1,260 | $43,748 | $8,400 | $35,348 |
| 2014 | $1,223 | $39,744 | $8,050 | $31,694 |
Source: Public Records
Map
Nearby Homes
- 10035 Oak Creek Canyon Ave
- 3761 Tohono Canyon St
- 10071 Lemon Valley Ave
- 9962 Catalina Canyon Ave
- 9923 Sierra Canyon Way
- 10227 Sunset Gardens Dr
- 10004 W Cherokee Ave
- 10046 Floragold Ct
- 3663 Coventry Gardens Dr
- 3614 Coventry Gardens Dr
- 3658 Auckland Castle St
- 10135 Diving Duck Ave
- 3618 Auckland Castle St
- 3552 Coventry Gardens Dr
- 3483 French Daisy St
- 9750 W Cherokee Ave Unit 1
- 10075 Yellow Canary Ave
- 10391 Avebury Manor Ln
- 10290 Profeta Ct
- 3615 Hardwick Hall Way
- 3769 Cape Solitude St
- 3763 Cape Solitude St
- 3757 Cape Solitude St
- 3770 Tohono Canyon St
- 10053 Oak Creek Canyon Ave
- 3751 Cape Solitude St
- 10059 Oak Creek Canyon Ave
- 3764 Tohono Canyon St
- 10047 Oak Creek Canyon Ave
- 3772 Cape Solitude St
- 3772 Cape Solitude St
- 10065 Oak Creek Canyon Ave
- 3758 Tohono Canyon St
- 3760 Cape Solitude St
- 3760 Cape Solitude St
- 10041 Oak Creek Canyon Ave Unit house
- 3745 Cape Solitude St
- 10071 Oak Creek Canyon Ave
- 3754 Cape Solitude St
- 3752 Tohono Canyon St