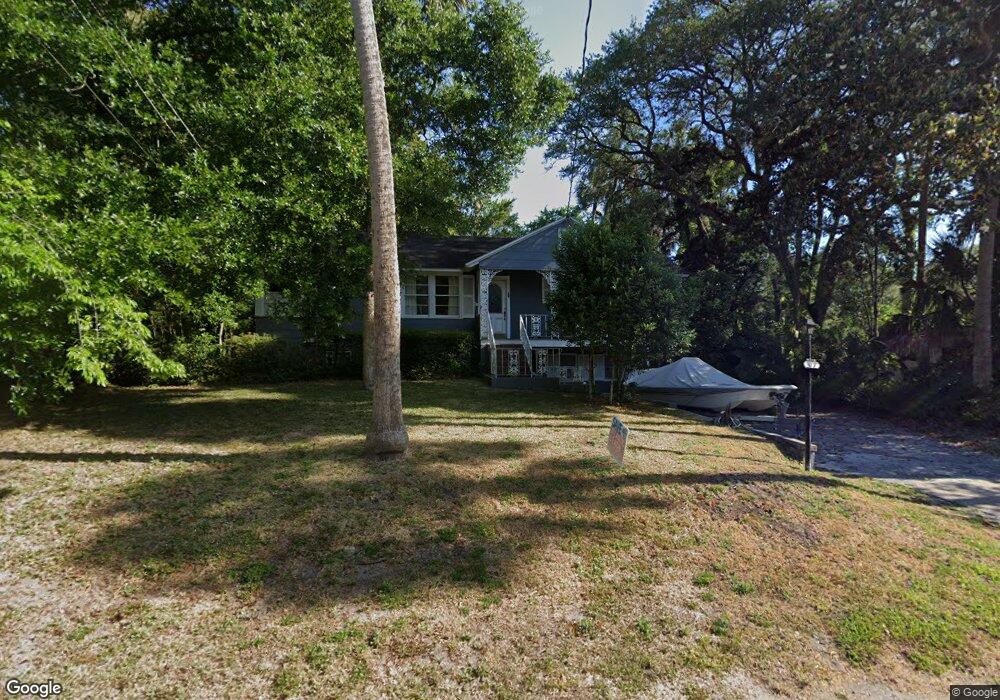
377 2nd St Atlantic Beach, FL 32233
Estimated Value: $1,828,000 - $2,014,000
4
Beds
3
Baths
2,118
Sq Ft
$920/Sq Ft
Est. Value
About This Home
This home is located at 377 2nd St, Atlantic Beach, FL 32233 and is currently estimated at $1,947,848, approximately $919 per square foot. 377 2nd St is a home located in Duval County with nearby schools including Atlantic Beach Elementary School, Mayport Middle School, and Duncan U. Fletcher High School.
Ownership History
Date
Name
Owned For
Owner Type
Purchase Details
Closed on
May 28, 2015
Sold by
Mcandrews Katherine C
Bought by
Osgrove Elizabeth C
Current Estimated Value
Purchase Details
Closed on
May 26, 2015
Sold by
Jensen Ellen C
Bought by
Cosgrove Elizabeth C
Purchase Details
Closed on
May 19, 2015
Sold by
Dunbar Cynthia C
Bought by
Cosgrove Elizabeth C
Purchase Details
Closed on
May 6, 2015
Sold by
Cissel William L
Bought by
Cosgrove Elizabeth C
Purchase Details
Closed on
Mar 16, 2015
Sold by
Cissel Stephen R
Bought by
Cosgrove Elizabeth C
Create a Home Valuation Report for This Property
The Home Valuation Report is an in-depth analysis detailing your home's value as well as a comparison with similar homes in the area
Home Values in the Area
Average Home Value in this Area
Purchase History
| Date | Buyer | Sale Price | Title Company |
|---|---|---|---|
| Osgrove Elizabeth C | $103,000 | Attorney | |
| Cosgrove Elizabeth C | $103,000 | Attorney | |
| Cosgrove Elizabeth C | $103,000 | Attorney | |
| Cosgrove Elizabeth C | $50,500 | None Available | |
| Cosgrove Elizabeth C | $40,000 | None Available | |
| Cosgrove Elizabeth C | $103,000 | Attorney |
Source: Public Records
Tax History
| Year | Tax Paid | Tax Assessment Tax Assessment Total Assessment is a certain percentage of the fair market value that is determined by local assessors to be the total taxable value of land and additions on the property. | Land | Improvement |
|---|---|---|---|---|
| 2026 | $28,361 | $1,546,193 | -- | -- |
| 2025 | $25,578 | $1,405,630 | -- | -- |
| 2024 | $20,711 | $1,802,117 | $1,625,000 | $177,117 |
| 2023 | $20,711 | $1,219,837 | $1,062,500 | $157,337 |
| 2022 | $18,430 | $1,173,257 | $1,037,000 | $136,257 |
| 2021 | $16,742 | $960,066 | $850,000 | $110,066 |
| 2020 | $16,738 | $953,960 | $850,000 | $103,960 |
| 2019 | $15,842 | $906,214 | $782,000 | $124,214 |
| 2018 | $14,388 | $801,062 | $680,000 | $121,062 |
| 2017 | $14,602 | $803,686 | $680,000 | $123,686 |
| 2016 | $14,727 | $795,938 | $0 | $0 |
| 2015 | $13,936 | $736,164 | $0 | $0 |
| 2014 | -- | $710,846 | $0 | $0 |
Source: Public Records
Map
Nearby Homes
Your Personal Tour Guide
Ask me questions while you tour the home.