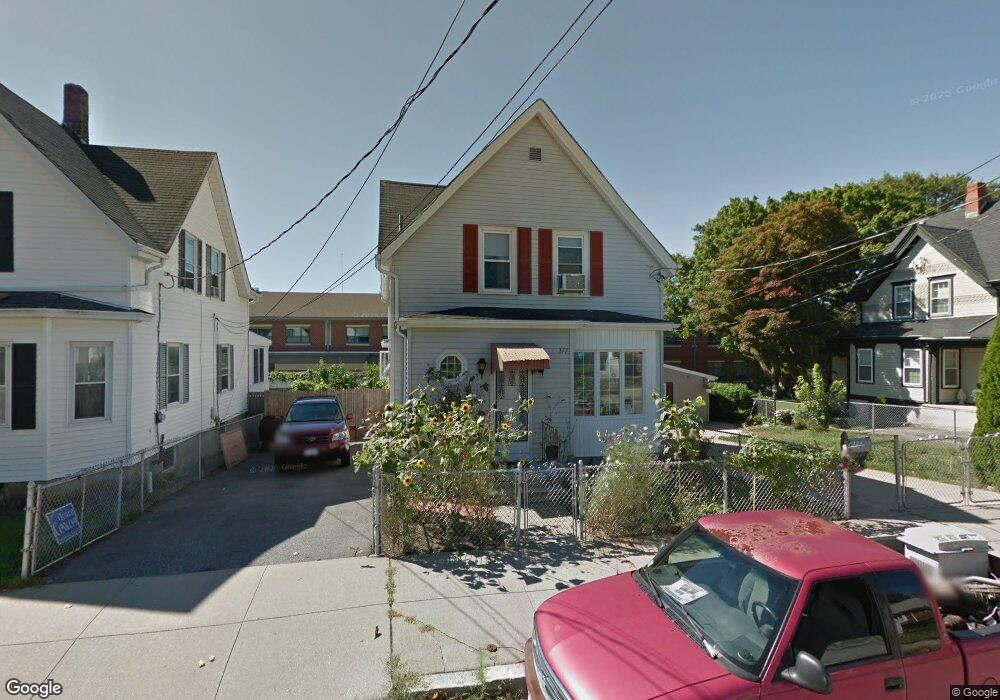
377 Anthony St Fall River, MA 02721
Maplewood NeighborhoodEstimated Value: $362,592 - $444,000
3
Beds
2
Baths
1,092
Sq Ft
$368/Sq Ft
Est. Value
About This Home
This home is located at 377 Anthony St, Fall River, MA 02721 and is currently estimated at $402,148, approximately $368 per square foot. 377 Anthony St is a home located in Bristol County with nearby schools including Letourneau Elementary School, Matthew J. Kuss Middle School, and B M C Durfee High School.
Ownership History
Date
Name
Owned For
Owner Type
Purchase Details
Closed on
Feb 1, 2010
Sold by
Tourigny Edmond R
Bought by
Dossantos Carlos
Current Estimated Value
Home Financials for this Owner
Home Financials are based on the most recent Mortgage that was taken out on this home.
Original Mortgage
$108,900
Outstanding Balance
$71,784
Interest Rate
4.95%
Mortgage Type
Purchase Money Mortgage
Estimated Equity
$330,364
Purchase Details
Closed on
Dec 14, 2007
Sold by
Arruda Jeannine
Bought by
Tourigny Edmond R
Home Financials for this Owner
Home Financials are based on the most recent Mortgage that was taken out on this home.
Original Mortgage
$175,000
Interest Rate
6.3%
Mortgage Type
Purchase Money Mortgage
Purchase Details
Closed on
Apr 11, 2006
Sold by
Eugene T Kij Ft and Arruda Jeannine
Bought by
Arruda Jeannine
Create a Home Valuation Report for This Property
The Home Valuation Report is an in-depth analysis detailing your home's value as well as a comparison with similar homes in the area
Home Values in the Area
Average Home Value in this Area
Purchase History
| Date | Buyer | Sale Price | Title Company |
|---|---|---|---|
| Dossantos Carlos | $178,000 | -- | |
| Tourigny Edmond R | $190,000 | -- | |
| Arruda Jeannine | -- | -- | |
| Arruda Jeannine | -- | -- |
Source: Public Records
Mortgage History
| Date | Status | Borrower | Loan Amount |
|---|---|---|---|
| Open | Dossantos Carlos | $108,900 | |
| Previous Owner | Tourigny Edmond R | $175,000 |
Source: Public Records
Tax History
| Year | Tax Paid | Tax Assessment Tax Assessment Total Assessment is a certain percentage of the fair market value that is determined by local assessors to be the total taxable value of land and additions on the property. | Land | Improvement |
|---|---|---|---|---|
| 2025 | $3,475 | $303,500 | $124,200 | $179,300 |
| 2024 | $3,274 | $284,900 | $119,500 | $165,400 |
| 2023 | $3,015 | $245,700 | $102,400 | $143,300 |
| 2022 | $2,776 | $220,000 | $93,100 | $126,900 |
| 2021 | $2,589 | $187,200 | $86,100 | $101,100 |
| 2020 | $2,589 | $179,200 | $82,400 | $96,800 |
| 2019 | $2,474 | $169,700 | $78,500 | $91,200 |
| 2018 | $2,276 | $155,700 | $77,100 | $78,600 |
| 2017 | $2,191 | $156,500 | $78,600 | $77,900 |
| 2016 | $2,122 | $155,700 | $81,900 | $73,800 |
| 2015 | $1,996 | $152,600 | $78,800 | $73,800 |
| 2014 | $1,973 | $156,800 | $83,000 | $73,800 |
Source: Public Records
Map
Nearby Homes
- 93 Lawton St
- 125 Carl St
- 478 Tucker St
- 186 Spencer St
- 495 Chicago St
- 539 Aetna St
- 59 Denver St
- 59 Wayne St
- 143 Meeson St
- 250 Laurel St
- 311 S Oxford St
- 545 Brayton Ave
- 0 Stafford Rd Unit 1393774
- 0 Stafford Rd Unit 73431501
- 119 Pebble St
- 21 Boyden St
- 231 Lapham St
- 1350 Rodman St
- 10 Aberdeen St
- 248 Jefferson St
- 371 Anthony St
- 385 Anthony St
- 359 Anthony St
- 399 Anthony St
- 343 Anthony St
- 370 Anthony St
- 384 Anthony St
- 407 Anthony St
- 358 Anthony St
- 415 Anthony St
- 400 Anthony St
- 8 Progress St
- 418 Anthony St
- 418 Anthony St Unit 3
- 418 Anthony St Unit 1
- 425 Anthony St
- 425 Anthony St Unit 3
- 403 Lawton St
- 389 Lawton St
- 413 Lawton St
Your Personal Tour Guide
Ask me questions while you tour the home.