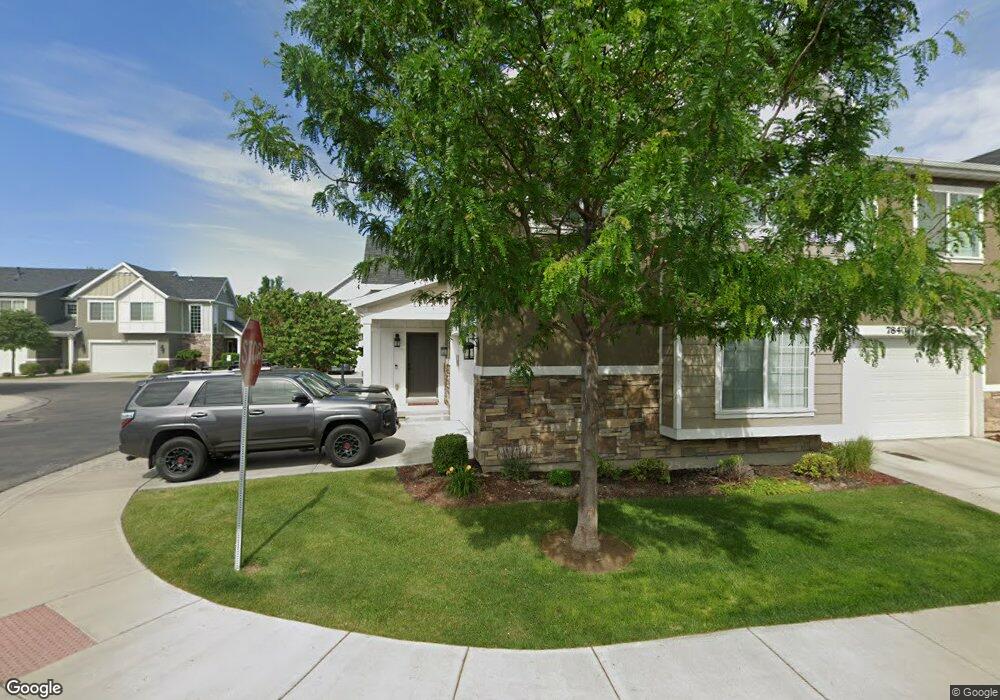
377 E Tractor Dr Unit 8 Midvale, UT 84047
Estimated Value: $565,000 - $662,000
3
Beds
3
Baths
2,170
Sq Ft
$283/Sq Ft
Est. Value
About This Home
This home is located at 377 E Tractor Dr Unit 8, Midvale, UT 84047 and is currently estimated at $614,659, approximately $283 per square foot. 377 E Tractor Dr Unit 8 is a home located in Salt Lake County with nearby schools including Midvalley Elementary School, Union Middle School, and Hillcrest High School.
Ownership History
Date
Name
Owned For
Owner Type
Purchase Details
Closed on
Nov 14, 2024
Sold by
611 Broadway Llc
Bought by
Phan Mike Hong and Welch Lindsey
Current Estimated Value
Home Financials for this Owner
Home Financials are based on the most recent Mortgage that was taken out on this home.
Original Mortgage
$618,589
Outstanding Balance
$612,431
Interest Rate
6.12%
Mortgage Type
FHA
Estimated Equity
$2,228
Purchase Details
Closed on
Jun 25, 2019
Sold by
Medford Matthew and Wiscombe Shawn D
Bought by
611 Broadway Llc
Purchase Details
Closed on
Feb 20, 2015
Sold by
Brad Reynolds Construction Inc
Bought by
Medford Matthew
Home Financials for this Owner
Home Financials are based on the most recent Mortgage that was taken out on this home.
Original Mortgage
$309,294
Interest Rate
3.75%
Mortgage Type
FHA
Create a Home Valuation Report for This Property
The Home Valuation Report is an in-depth analysis detailing your home's value as well as a comparison with similar homes in the area
Home Values in the Area
Average Home Value in this Area
Purchase History
| Date | Buyer | Sale Price | Title Company |
|---|---|---|---|
| Phan Mike Hong | -- | Real Advantage Title Insurance | |
| Phan Mike Hong | -- | Real Advantage Title Insurance | |
| 611 Broadway Llc | -- | First American Title | |
| Medford Matthew | -- | Integrated Title Ins Svcs |
Source: Public Records
Mortgage History
| Date | Status | Borrower | Loan Amount |
|---|---|---|---|
| Open | Phan Mike Hong | $618,589 | |
| Closed | Phan Mike Hong | $618,589 | |
| Previous Owner | Medford Matthew | $309,294 |
Source: Public Records
Tax History
| Year | Tax Paid | Tax Assessment Tax Assessment Total Assessment is a certain percentage of the fair market value that is determined by local assessors to be the total taxable value of land and additions on the property. | Land | Improvement |
|---|---|---|---|---|
| 2025 | $3,433 | $615,500 | $72,900 | $542,600 |
| 2024 | $3,433 | $563,600 | $68,200 | $495,400 |
| 2023 | $3,208 | $521,900 | $64,800 | $457,100 |
| 2022 | $3,303 | $524,900 | $63,600 | $461,300 |
| 2021 | $3,059 | $415,700 | $54,300 | $361,400 |
| 2020 | $2,938 | $377,800 | $54,300 | $323,500 |
| 2019 | $2,614 | $327,400 | $51,300 | $276,100 |
| 2016 | $2,308 | $272,600 | $67,500 | $205,100 |
Source: Public Records
Map
Nearby Homes
- 397 E Tractor Dr Unit 103
- 379 E Horse Creek Dr
- 393 E Corral Creek Dr
- 7824 S 280 E
- 354 E 7635 South St
- 350 E 7635 South St
- 330 E 7635 S Unit 344
- 7613 S 300 E
- 600 E Briarsprings Cir
- 190 E White Spruce Cove Unit 805
- 257 E Water Mill Way
- 7579 S 520 E
- 257 Water Mill Way Unit 211
- 274 E Water Mill Way Unit 230
- 7359 S Dewmar Ct W Unit 32
- 489 E 7800 S Unit 2
- 7363 S Dewmar Ct W Unit 33
- 7342 S Seven Tree Ln W Unit 77
- 7329 S Seven Tree Ln W Unit 85
- 7371 S Dewmar Ct W Unit 35
- 377 E Tractor Dr
- 7840 S Woodard Farms Dr
- 7840 S Woodard Farms Dr Unit 7
- 7836 S Woodard Farms Dr Unit 6
- 7832 S Woodard Farms Dr Unit 5
- 7832 S Woodard Farms Dr
- 393 E Tractor Dr Unit 104
- 393 E Tractor Dr
- 7842 S Farm House Ln Unit 11
- 7848 S Farm House Ln Unit 12
- 7848 S Farm House Ln
- 7838 S Farm House Ln
- 7838 S Farm House Ln Unit 10
- 7834 S Farm House Ln Unit 9
- 397 E Tractor Dr Unit 103
- 7824 S Woodard Farms Dr
- 7824 S Woodard Farms Dr Unit 4
- 7856 S Farm House Ln Unit 13
- 7856 S Farm House Ln
- 397 E Tractor Dr Unit 103
Your Personal Tour Guide
Ask me questions while you tour the home.