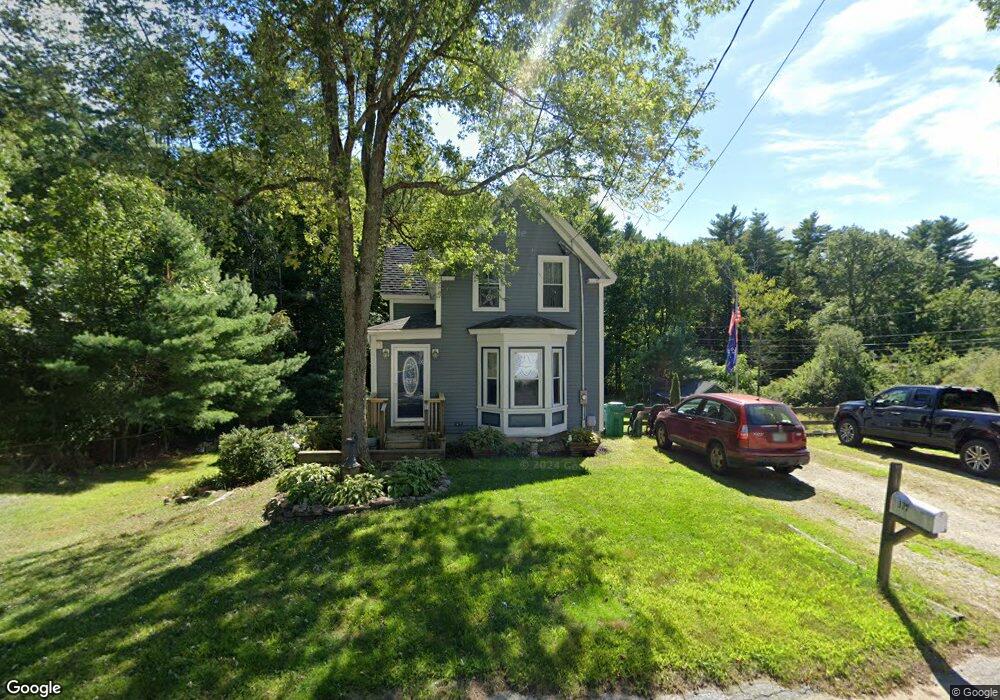
377 Main St Fremont, NH 03044
Estimated Value: $353,000 - $407,000
2
Beds
2
Baths
1,077
Sq Ft
$355/Sq Ft
Est. Value
About This Home
This home is located at 377 Main St, Fremont, NH 03044 and is currently estimated at $381,890, approximately $354 per square foot. 377 Main St is a home located in Rockingham County with nearby schools including Ellis School.
Ownership History
Date
Name
Owned For
Owner Type
Purchase Details
Closed on
Nov 11, 2024
Sold by
Smith Brian S
Bought by
Brian S Smith Ret and Smith
Current Estimated Value
Purchase Details
Closed on
Apr 8, 2020
Sold by
Smith Brian S and Smith Brenda S
Bought by
Smith Brian S
Home Financials for this Owner
Home Financials are based on the most recent Mortgage that was taken out on this home.
Original Mortgage
$121,100
Interest Rate
3.3%
Mortgage Type
New Conventional
Purchase Details
Closed on
Jul 1, 1998
Sold by
Pike Stephen D
Bought by
Smith Brian S and Smith Brenda S
Home Financials for this Owner
Home Financials are based on the most recent Mortgage that was taken out on this home.
Original Mortgage
$98,211
Interest Rate
7.04%
Create a Home Valuation Report for This Property
The Home Valuation Report is an in-depth analysis detailing your home's value as well as a comparison with similar homes in the area
Home Values in the Area
Average Home Value in this Area
Purchase History
| Date | Buyer | Sale Price | Title Company |
|---|---|---|---|
| Brian S Smith Ret | -- | None Available | |
| Brian S Smith Ret | -- | None Available | |
| Smith Brian S | -- | None Available | |
| Smith Brian S | -- | None Available | |
| Smith Brian S | -- | None Available | |
| Smith Brian S | $99,000 | -- | |
| Smith Brian S | $99,000 | -- |
Source: Public Records
Mortgage History
| Date | Status | Borrower | Loan Amount |
|---|---|---|---|
| Previous Owner | Smith Brian S | $121,100 | |
| Previous Owner | Smith Brian S | $148,800 | |
| Previous Owner | Smith Brian S | $98,211 |
Source: Public Records
Tax History Compared to Growth
Tax History
| Year | Tax Paid | Tax Assessment Tax Assessment Total Assessment is a certain percentage of the fair market value that is determined by local assessors to be the total taxable value of land and additions on the property. | Land | Improvement |
|---|---|---|---|---|
| 2024 | $5,448 | $206,600 | $76,400 | $130,200 |
| 2023 | $4,874 | $206,600 | $76,400 | $130,200 |
| 2022 | $4,791 | $206,600 | $76,400 | $130,200 |
| 2021 | $4,611 | $206,600 | $76,400 | $130,200 |
| 2020 | $6,073 | $205,100 | $76,400 | $128,700 |
| 2019 | $10,855 | $155,600 | $62,700 | $92,900 |
| 2018 | $4,575 | $155,600 | $62,700 | $92,900 |
| 2017 | $0 | $155,600 | $62,700 | $92,900 |
| 2016 | $5,188 | $155,600 | $62,700 | $92,900 |
| 2015 | $4,512 | $155,600 | $62,700 | $92,900 |
| 2014 | $4,267 | $151,200 | $62,700 | $88,500 |
| 2013 | $4,311 | $151,200 | $62,700 | $88,500 |
Source: Public Records
Map
Nearby Homes
- 308 Main St
- 54 Cavil Mill Rd
- 454 Main St
- 94 Thunder Rd
- 38 Bluefish Dr
- 240 Main St
- 45 Whittier Dr
- 164 Hall Rd
- 188 Main St
- 564 Main St
- Lot 7-0 Sanborn Meadow Unit 7-0
- Lot 7-3 Sanborn Meadow Unit 7-3
- Lot 7-2 Sanborn Meadow Unit 7-2
- 118 Hall Rd Unit 3
- 98 Copp Dr
- 32 Country Ln
- 60 Copp Dr
- 21 Jennifer Ln
- 245 Danville Rd
- 13 Huckleberry Rd