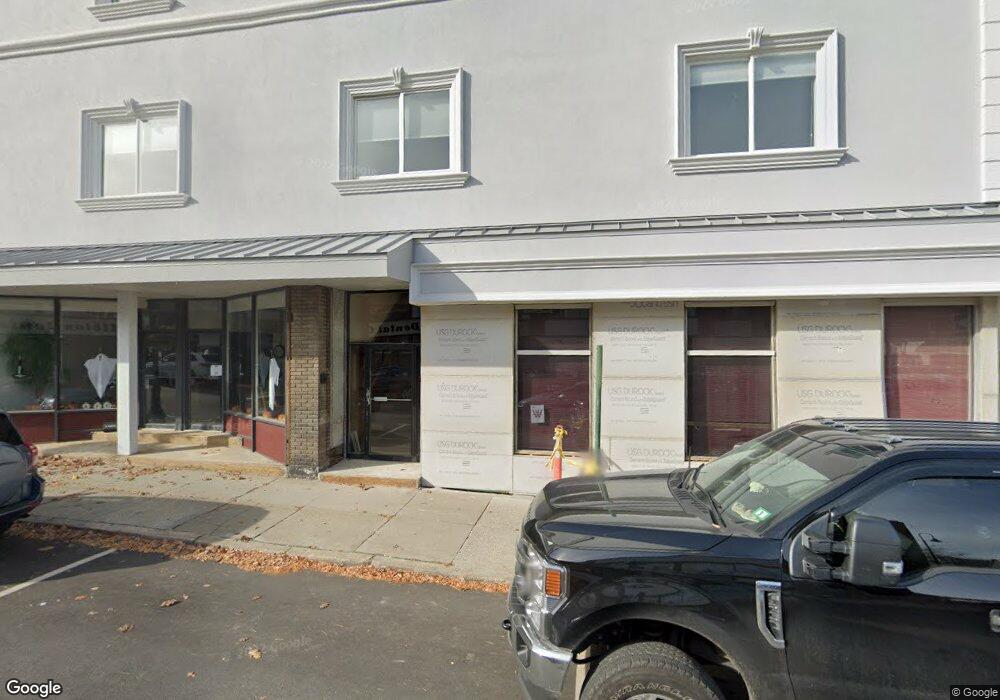
377 Main St Wakefield, MA 01880
Downtown Wakefield NeighborhoodEstimated Value: $1,027,698
Studio
2
Baths
5,699
Sq Ft
$180/Sq Ft
Est. Value
About This Home
This home is located at 377 Main St, Wakefield, MA 01880 and is currently estimated at $1,027,698, approximately $180 per square foot. 377 Main St is a home located in Middlesex County with nearby schools including Wakefield Memorial High School, St Joseph School, and Odyssey Day School.
Ownership History
Date
Name
Owned For
Owner Type
Purchase Details
Closed on
Feb 20, 2002
Sold by
Edwards Rt and Dourdon Leo E
Bought by
Psda T and Rodrigues Dana
Current Estimated Value
Home Financials for this Owner
Home Financials are based on the most recent Mortgage that was taken out on this home.
Original Mortgage
$307,500
Outstanding Balance
$127,327
Interest Rate
7.08%
Mortgage Type
Commercial
Estimated Equity
$900,371
Create a Home Valuation Report for This Property
The Home Valuation Report is an in-depth analysis detailing your home's value as well as a comparison with similar homes in the area
Home Values in the Area
Average Home Value in this Area
Purchase History
| Date | Buyer | Sale Price | Title Company |
|---|---|---|---|
| Psda T | $410,000 | -- |
Source: Public Records
Mortgage History
| Date | Status | Borrower | Loan Amount |
|---|---|---|---|
| Open | Psda T | $307,500 | |
| Previous Owner | Psda T | $27,000 |
Source: Public Records
Tax History
| Year | Tax Paid | Tax Assessment Tax Assessment Total Assessment is a certain percentage of the fair market value that is determined by local assessors to be the total taxable value of land and additions on the property. | Land | Improvement |
|---|---|---|---|---|
| 2025 | $18,070 | $830,400 | $187,300 | $643,100 |
| 2024 | $17,325 | $798,400 | $180,000 | $618,400 |
| 2023 | $13,925 | $620,000 | $153,400 | $466,600 |
| 2022 | $14,181 | $596,600 | $147,500 | $449,100 |
| 2021 | $14,146 | $573,400 | $143,200 | $430,200 |
| 2020 | $14,289 | $573,400 | $143,200 | $430,200 |
| 2019 | $14,004 | $556,800 | $139,100 | $417,700 |
| 2018 | $13,740 | $536,500 | $135,800 | $400,700 |
| 2017 | $13,452 | $518,400 | $131,300 | $387,100 |
| 2016 | $13,285 | $491,500 | $125,000 | $366,500 |
| 2015 | $13,379 | $491,500 | $125,000 | $366,500 |
| 2014 | $12,813 | $491,500 | $125,000 | $366,500 |
Source: Public Records
Map
Nearby Homes
- 43-45 Crescent St
- 16 Pleasant St
- 10 Wakefield Ave Unit B
- 62 Foundry St Unit 310
- 62 Foundry St Unit 204
- 62 Foundry St Unit 402
- 62 Foundry St Unit 507
- 62 Foundry St Unit 208
- 62 Foundry St Unit 414
- 62 Foundry St Unit 210
- 69 Foundry St Unit 310
- 69 Foundry St Unit 416
- 35 Richardson St Unit 2
- 248 Albion St Unit 231
- 248 Albion St Unit 321
- 1 Traverse St Unit E
- 39 Cedar St
- 21 Herbert St Unit A
- 57 Wave Ave
- 61 Nahant St
- 1 Albion St Unit 3
- 1 Albion St Unit 2
- 1 Albion St Unit 1
- 1 Albion St
- 11 Albion St Unit 11
- 8 Albion St
- 385 Main St
- 13 Albion St
- 8 Foster St
- 12 Albion St
- 17-1 Albion St
- 17-17A Albion St
- 17 Albion St Unit B
- 17 Albion St Unit A
- 17 Albion St
- 391 Main St Unit 391
- 391 Main St Unit 1
- 391 Main St
- 389 Main St Unit 3
- 389 Main St Unit 2
Your Personal Tour Guide
Ask me questions while you tour the home.