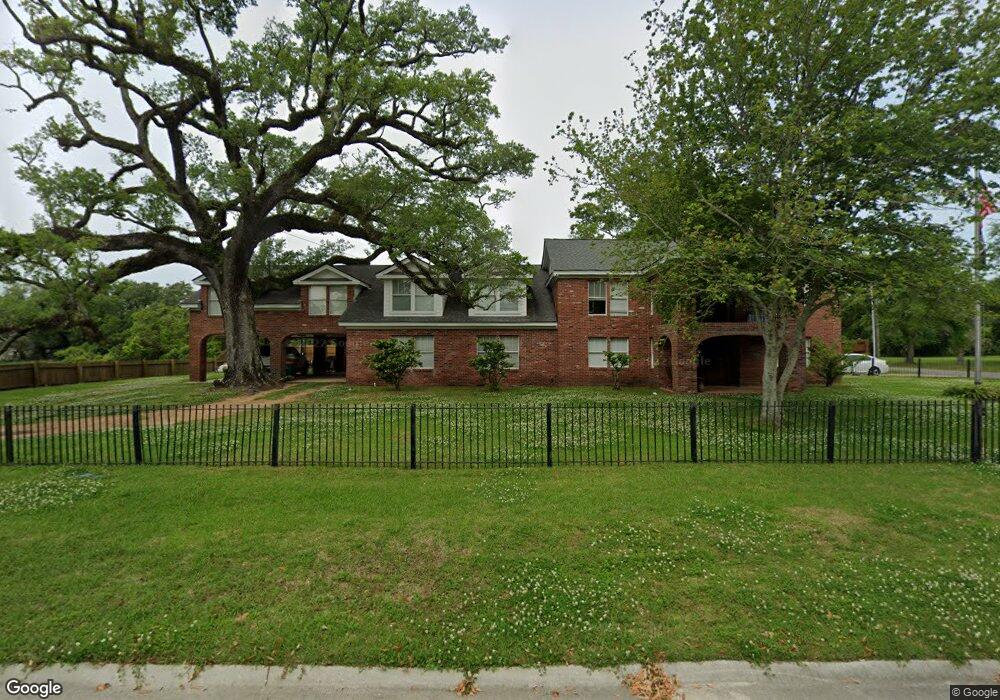
377 Maple St Biloxi, MS 39530
Estimated Value: $298,000 - $747,000
6
Beds
5
Baths
4,800
Sq Ft
$108/Sq Ft
Est. Value
About This Home
This home is located at 377 Maple St, Biloxi, MS 39530 and is currently estimated at $517,700, approximately $107 per square foot. 377 Maple St is a home located in Harrison County with nearby schools including Gorenflo Elementary School, Biloxi Junior High School, and Biloxi High School.
Ownership History
Date
Name
Owned For
Owner Type
Purchase Details
Closed on
Mar 31, 2021
Sold by
Bradley Tana M and Butera Thomas A
Bought by
Champagne Christopher J
Current Estimated Value
Purchase Details
Closed on
Nov 2, 2017
Sold by
Mark D Nelson
Bought by
Champagne C J
Home Financials for this Owner
Home Financials are based on the most recent Mortgage that was taken out on this home.
Original Mortgage
$228,000
Interest Rate
3.94%
Create a Home Valuation Report for This Property
The Home Valuation Report is an in-depth analysis detailing your home's value as well as a comparison with similar homes in the area
Home Values in the Area
Average Home Value in this Area
Purchase History
| Date | Buyer | Sale Price | Title Company |
|---|---|---|---|
| Champagne Christopher J | -- | None Listed On Document | |
| Champagne C J | -- | -- |
Source: Public Records
Mortgage History
| Date | Status | Borrower | Loan Amount |
|---|---|---|---|
| Previous Owner | Champagne C J | $228,000 | |
| Previous Owner | Champagne C J | -- |
Source: Public Records
Tax History
| Year | Tax Paid | Tax Assessment Tax Assessment Total Assessment is a certain percentage of the fair market value that is determined by local assessors to be the total taxable value of land and additions on the property. | Land | Improvement |
|---|---|---|---|---|
| 2025 | $3,445 | $33,507 | $0 | $0 |
| 2024 | $3,294 | $32,447 | $0 | $0 |
| 2023 | $3,213 | $32,002 | $0 | $0 |
| 2022 | $3,213 | $32,002 | $0 | $0 |
| 2021 | $3,205 | $31,926 | $0 | $0 |
| 2020 | $2,950 | $29,574 | $0 | $0 |
| 2019 | $2,950 | $29,574 | $0 | $0 |
| 2018 | $3,790 | $37,217 | $0 | $0 |
| 2017 | $3,790 | $37,217 | $0 | $0 |
| 2015 | $3,953 | $35,969 | $0 | $0 |
| 2014 | -- | $32,289 | $0 | $0 |
| 2013 | -- | $35,969 | $3,680 | $32,289 |
Source: Public Records
Map
Nearby Homes
Your Personal Tour Guide
Ask me questions while you tour the home.