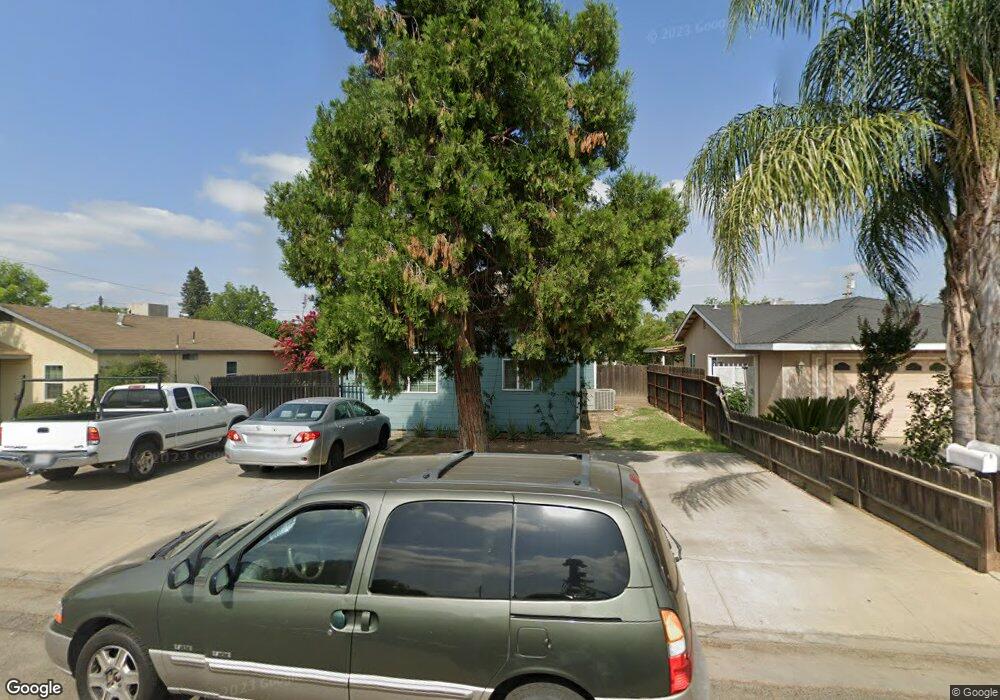
377 N Brundage Ave Farmersville, CA 93223
Estimated Value: $293,168 - $338,000
3
Beds
3
Baths
1,700
Sq Ft
$185/Sq Ft
Est. Value
About This Home
This home is located at 377 N Brundage Ave, Farmersville, CA 93223 and is currently estimated at $314,542, approximately $185 per square foot. 377 N Brundage Ave is a home located in Tulare County with nearby schools including J.E. Hester Elementary School, George L. Snowden Elementary School, and Freedom Elementary School.
Ownership History
Date
Name
Owned For
Owner Type
Purchase Details
Closed on
Mar 9, 2006
Sold by
Cruz Jose M
Bought by
Zavala Salvador C and Escobar Maria T Lainez
Current Estimated Value
Home Financials for this Owner
Home Financials are based on the most recent Mortgage that was taken out on this home.
Original Mortgage
$156,800
Outstanding Balance
$91,315
Interest Rate
6.69%
Mortgage Type
Purchase Money Mortgage
Estimated Equity
$223,227
Purchase Details
Closed on
Mar 24, 2003
Sold by
Campbell Carrol G
Bought by
Cruz Jose M and Zavala Salvador C
Home Financials for this Owner
Home Financials are based on the most recent Mortgage that was taken out on this home.
Original Mortgage
$74,335
Interest Rate
5.75%
Mortgage Type
FHA
Purchase Details
Closed on
Mar 20, 2001
Sold by
Campbell Courtney W
Bought by
Campbell Carrol G and Campbell Larry A
Create a Home Valuation Report for This Property
The Home Valuation Report is an in-depth analysis detailing your home's value as well as a comparison with similar homes in the area
Home Values in the Area
Average Home Value in this Area
Purchase History
| Date | Buyer | Sale Price | Title Company |
|---|---|---|---|
| Zavala Salvador C | -- | Chicago Title Co | |
| Cruz Jose M | $75,000 | -- | |
| Campbell Larry A | -- | -- | |
| Campbell Carrol G | -- | -- | |
| Campbell Carrol G | -- | -- |
Source: Public Records
Mortgage History
| Date | Status | Borrower | Loan Amount |
|---|---|---|---|
| Open | Zavala Salvador C | $156,800 | |
| Previous Owner | Cruz Jose M | $74,335 |
Source: Public Records
Tax History Compared to Growth
Tax History
| Year | Tax Paid | Tax Assessment Tax Assessment Total Assessment is a certain percentage of the fair market value that is determined by local assessors to be the total taxable value of land and additions on the property. | Land | Improvement |
|---|---|---|---|---|
| 2025 | $1,632 | $155,779 | $60,580 | $95,199 |
| 2024 | $1,632 | $152,726 | $59,393 | $93,333 |
| 2023 | $1,635 | $149,732 | $58,229 | $91,503 |
| 2022 | $1,513 | $146,797 | $57,088 | $89,709 |
| 2021 | $1,482 | $143,919 | $55,969 | $87,950 |
| 2020 | $1,470 | $142,443 | $55,395 | $87,048 |
| 2019 | $1,482 | $139,650 | $54,309 | $85,341 |
| 2018 | $1,441 | $136,912 | $53,244 | $83,668 |
| 2017 | $1,453 | $134,227 | $52,200 | $82,027 |
| 2016 | $1,373 | $131,595 | $51,176 | $80,419 |
| 2015 | $873 | $119,000 | $30,000 | $89,000 |
| 2014 | $873 | $87,000 | $22,000 | $65,000 |
Source: Public Records
Map
Nearby Homes
- 903 E Ash St
- 885 E Ash St
- 732 N Dwight Ave
- 753 N Brundage Ave
- 738 E Larry St
- 680 E Larry St
- 438 N Magnolia Ave
- 209 S Magnolia Ave
- 528 S Camelia Ave
- 371 N Farmersville Blvd
- 701 Farmersville Rd
- 896 Farmersville Rd
- 322 E Citrus Dr
- 327 S Farmersville Blvd
- 0 S Farmersville Blvd Unit 238390
- 245 W Oakland St
- 0 Avenue 288
- 1643 Tehama Ave
- 0 Avenue 288
- 0 Visalia Rd
- 391 N Brundage Ave
- 361 N Brundage Ave
- 347 N Brundage Ave
- 405 N Brundage Ave
- 329 N Brundage Ave
- 425 N Brundage Ave
- 317 N Brundage Ave
- 368 N Brundage Ave
- 390 N Brundage Ave
- 404 N Brundage Ave
- 348 N Brundage Ave
- 420 N Brundage Ave
- 330 N Brundage Ave
- 297 N Brundage Ave
- 453 N Brundage Ave
- 314 N Brundage Ave
- 436 N Brundage Ave
- 306 N Brundage Ave
- 376 N Oakview Ave
- 396 N Oakview Ave