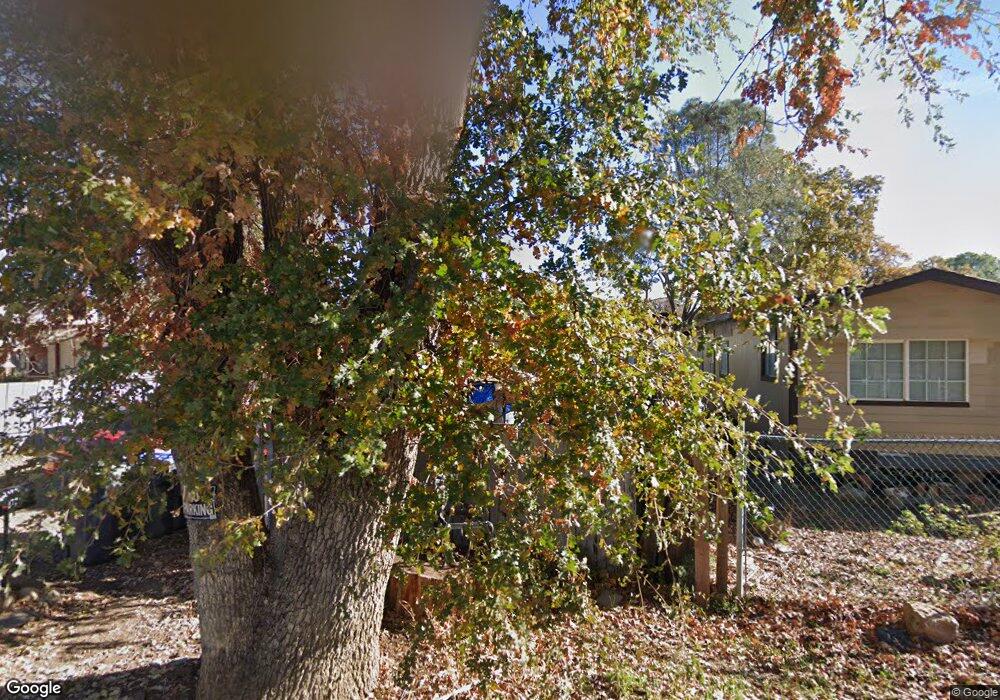
3770 Howard Ave Clearlake, CA 95422
Estimated Value: $120,884 - $210,000
2
Beds
1
Bath
982
Sq Ft
$159/Sq Ft
Est. Value
About This Home
This home is located at 3770 Howard Ave, Clearlake, CA 95422 and is currently estimated at $156,471, approximately $159 per square foot. 3770 Howard Ave is a home located in Lake County with nearby schools including Lower Lake High School, Konocti Private School, and Clearlake Seventh-day Adventist Christian School.
Ownership History
Date
Name
Owned For
Owner Type
Purchase Details
Closed on
Nov 1, 2010
Sold by
Andrade Jose
Bought by
Andrade Jose and Andrade Rebecca Lynn
Current Estimated Value
Purchase Details
Closed on
Oct 29, 2010
Sold by
Andrade Rebecca Lynn
Bought by
Andrade Jose
Purchase Details
Closed on
Mar 23, 2010
Sold by
Midfirst Bank
Bought by
The Secretary Of Housing & Urban Develop
Purchase Details
Closed on
Feb 3, 2010
Sold by
Laing Dean Jay
Bought by
Midfirst Bank
Purchase Details
Closed on
Apr 4, 2006
Sold by
Raybuck Bonds Billie Raye and Raybuck Bonds Kimberly
Bought by
Raybuck Bonds Billie Raye and Raybuck Bonds Kimberly
Purchase Details
Closed on
Oct 20, 2005
Sold by
Bonds Kimberly Raybuck
Bought by
Raybuck Bonds Billie Raye and Raybuck Bonds Kimberly
Create a Home Valuation Report for This Property
The Home Valuation Report is an in-depth analysis detailing your home's value as well as a comparison with similar homes in the area
Purchase History
| Date | Buyer | Sale Price | Title Company |
|---|---|---|---|
| Andrade Jose | -- | Fidelity National Title Co | |
| Andrade Jose | $25,000 | Chicago Title Company | |
| Andrade Jose | -- | Chicago Title Company | |
| The Secretary Of Housing & Urban Develop | -- | First American Title | |
| Midfirst Bank | $36,047 | None Available | |
| Raybuck Bonds Billie Raye | -- | None Available | |
| Raybuck Bonds Billie Raye | -- | None Available |
Source: Public Records
Tax History
| Year | Tax Paid | Tax Assessment Tax Assessment Total Assessment is a certain percentage of the fair market value that is determined by local assessors to be the total taxable value of land and additions on the property. | Land | Improvement |
|---|---|---|---|---|
| 2025 | $445 | $31,392 | $12,555 | $18,837 |
| 2024 | $735 | $30,777 | $12,309 | $18,468 |
| 2023 | $1,026 | $30,174 | $12,068 | $18,106 |
| 2022 | $992 | $29,583 | $11,832 | $17,751 |
| 2021 | $972 | $29,003 | $11,600 | $17,403 |
| 2020 | $956 | $28,707 | $11,482 | $17,225 |
| 2019 | $1,008 | $28,145 | $11,257 | $16,888 |
| 2018 | $992 | $27,594 | $11,037 | $16,557 |
| 2017 | $959 | $27,054 | $10,821 | $16,233 |
| 2016 | $948 | $26,524 | $10,609 | $15,915 |
| 2015 | $360 | $26,126 | $10,450 | $15,676 |
| 2014 | $926 | $25,615 | $10,246 | $15,369 |
Source: Public Records
Map
Nearby Homes
- 3723 Buckeye St
- 14390 Austin Rd
- 3635 Cottonwood St
- 14420 Walnut Ave
- 3767 Buckeye St
- 3740 Mullen Ave
- 14385 Uhl Ave
- 3525 Madrone St
- 3890 Schultz Ave
- 14300 Robinson Ave
- 14565 Uhl Ave
- 3771 Manchester Ave
- 15545 Pine St
- 3882 Pine St
- 3892 Schultz Ave
- 3519 Maple St
- 3995 Mullen Ave
- 14707 Walnut Ave
- 3797 Robinson Ave
- 14724 Walnut Ave
- 3760 Howard Ave
- 3750 Howard Ave
- 3763 Oakland Ave
- 3773 Oakland Ave
- 14480 Alvita Ave
- 14470 Alvita Ave
- 3775 Howard Ave
- 3785 Howard Ave
- 3765 Howard Ave
- 14460 Alvita Ave
- 14490 Alvita Ave
- 3755 Howard Ave
- 3730 Howard Ave
- 3745 Oakland Ave
- 14510 Alvita Ave
- 3760 Oakland Ave
- 3770 Jago Ave
- 3720 Howard Ave
- 3790 Jago Ave
- 3735 Howard Ave
Your Personal Tour Guide
Ask me questions while you tour the home.