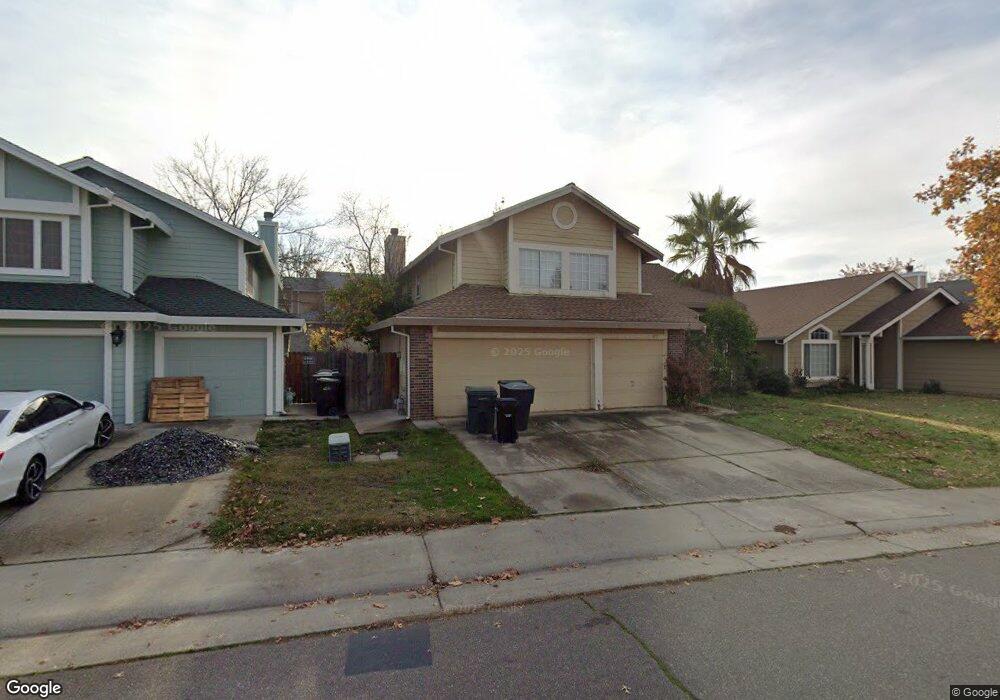
3770 Pine Hollow Way Antelope, CA 95843
Estimated Value: $551,000 - $574,000
4
Beds
3
Baths
2,244
Sq Ft
$251/Sq Ft
Est. Value
About This Home
This home is located at 3770 Pine Hollow Way, Antelope, CA 95843 and is currently estimated at $563,817, approximately $251 per square foot. 3770 Pine Hollow Way is a home located in Sacramento County with nearby schools including Oak Hill Elementary School, Wilson C. Riles Middle School, and Center High School.
Ownership History
Date
Name
Owned For
Owner Type
Purchase Details
Closed on
Feb 18, 2011
Sold by
Gray Mark A and Gray Julia
Bought by
Robison Davina
Current Estimated Value
Home Financials for this Owner
Home Financials are based on the most recent Mortgage that was taken out on this home.
Original Mortgage
$177,255
Outstanding Balance
$121,119
Interest Rate
4.75%
Mortgage Type
FHA
Estimated Equity
$442,698
Purchase Details
Closed on
Mar 22, 2007
Sold by
Gray Mark A and Gray Julia
Bought by
Gray Mark A and Gray Julia
Home Financials for this Owner
Home Financials are based on the most recent Mortgage that was taken out on this home.
Original Mortgage
$396,000
Interest Rate
7.9%
Mortgage Type
New Conventional
Purchase Details
Closed on
Feb 23, 2005
Sold by
Armstrong Benjamin and Armstrong Patricia J
Bought by
Gray Mark A and Grey Julia
Home Financials for this Owner
Home Financials are based on the most recent Mortgage that was taken out on this home.
Original Mortgage
$364,500
Interest Rate
5.66%
Mortgage Type
Purchase Money Mortgage
Create a Home Valuation Report for This Property
The Home Valuation Report is an in-depth analysis detailing your home's value as well as a comparison with similar homes in the area
Home Values in the Area
Average Home Value in this Area
Purchase History
| Date | Buyer | Sale Price | Title Company |
|---|---|---|---|
| Robison Davina | $195,000 | Chicago Title Company | |
| Gray Mark A | -- | Chicago Title Co | |
| Gray Mark A | $405,000 | -- |
Source: Public Records
Mortgage History
| Date | Status | Borrower | Loan Amount |
|---|---|---|---|
| Open | Robison Davina | $177,255 | |
| Previous Owner | Gray Mark A | $396,000 | |
| Previous Owner | Gray Mark A | $364,500 |
Source: Public Records
Tax History
| Year | Tax Paid | Tax Assessment Tax Assessment Total Assessment is a certain percentage of the fair market value that is determined by local assessors to be the total taxable value of land and additions on the property. | Land | Improvement |
|---|---|---|---|---|
| 2025 | $2,905 | $249,816 | $108,894 | $140,922 |
| 2024 | $2,905 | $244,918 | $106,759 | $138,159 |
| 2023 | $2,841 | $240,116 | $104,666 | $135,450 |
| 2022 | $2,815 | $235,409 | $102,614 | $132,795 |
| 2021 | $2,887 | $230,794 | $100,602 | $130,192 |
| 2020 | $3,108 | $228,429 | $99,571 | $128,858 |
| 2019 | $2,833 | $223,951 | $97,619 | $126,332 |
| 2018 | $2,768 | $219,560 | $95,705 | $123,855 |
| 2017 | $2,684 | $215,256 | $93,829 | $121,427 |
| 2016 | $2,633 | $211,037 | $91,990 | $119,047 |
| 2015 | $2,445 | $207,868 | $90,609 | $117,259 |
| 2014 | $2,493 | $203,798 | $88,835 | $114,963 |
Source: Public Records
Map
Nearby Homes
- 8425 Morning Skye Way
- 3707 Pinehill Way
- 8432 Giverny Cir
- 3941 Grey Livery Way
- 8541 Brisenbourg Way
- 3724 Black Eagle Dr
- 4009 Honey Rose Place
- 4115 Copper Hill Ct
- 8111 Aztec Way
- 4142 Lake Placid Ct
- 8256 Benjamin Dr
- 4133 Singing Tree Way
- 4246 Albertville Way
- 5160 Huckleberry Way
- 9620 Mason Trails Rd
- 8121 Deer Spring Cir
- 8434 Walerga Rd Unit 327
- 3549 Misty Lake Dr
- 3541 Misty Lake Dr
- 8233 Dalkeith Way
- 3766 Pine Hollow Way
- 3774 Pine Hollow Way
- 8407 Honey Hill Ct
- 3762 Pine Hollow Way
- 8421 Morning Skye Way
- 3753 Elk River Ct
- 3756 Elk River Ct
- 3767 Pine Hollow Way
- 8401 Honey Hill Ct
- 3756 Pine Hollow Way
- 3763 Pine Hollow Way
- 8412 Honey Hill Ct
- 8416 Honey Hill Ct
- 8408 Honey Hill Ct
- 8400 Honey Hill Ct
- 3749 Elk River Ct
- 8420 Morning Skye Way
- 8404 Honey Hill Ct
- 3750 Pine Hollow Way
- 3752 Elk River Ct
Your Personal Tour Guide
Ask me questions while you tour the home.