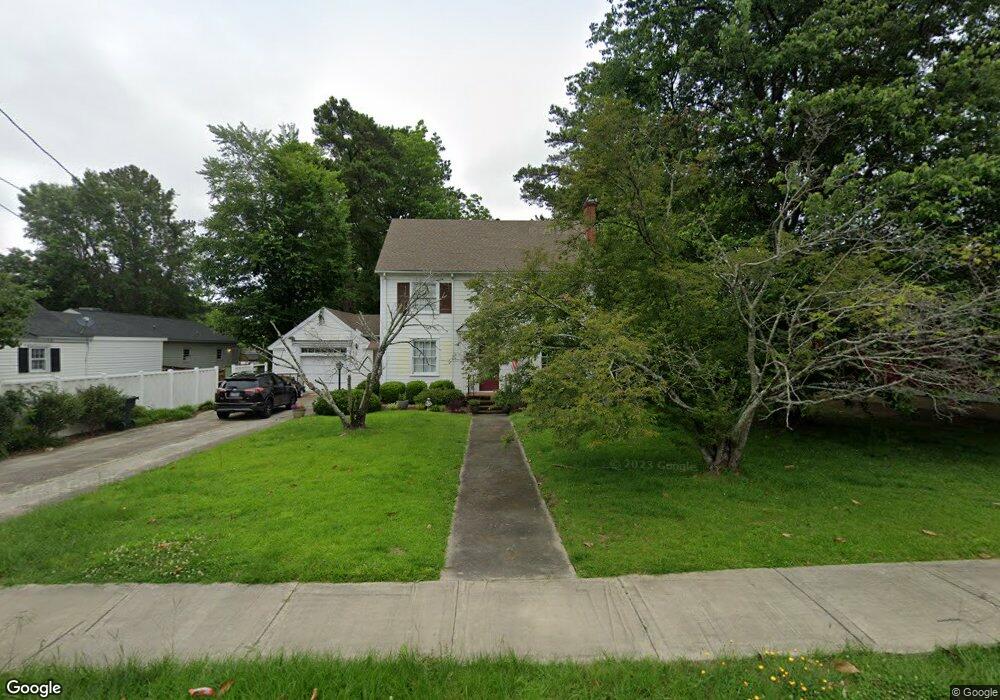
3770 Wilson St W Farmville, NC 27828
Estimated Value: $241,000 - $297,000
5
Beds
2
Baths
2,300
Sq Ft
$115/Sq Ft
Est. Value
About This Home
This home is located at 3770 Wilson St W, Farmville, NC 27828 and is currently estimated at $264,389, approximately $114 per square foot. 3770 Wilson St W is a home located in Pitt County with nearby schools including H.B. Sugg Elementary School, Sam D. Bundy Elementary School, and Farmville Middle School.
Ownership History
Date
Name
Owned For
Owner Type
Purchase Details
Closed on
Mar 24, 2025
Sold by
Kuenzi Kristen M and Respess Kristen Mcclanahan
Bought by
Craft Karell
Current Estimated Value
Home Financials for this Owner
Home Financials are based on the most recent Mortgage that was taken out on this home.
Original Mortgage
$258,236
Outstanding Balance
$256,914
Interest Rate
6.87%
Mortgage Type
FHA
Estimated Equity
$7,475
Purchase Details
Closed on
Aug 21, 2017
Sold by
Earley John W and Earley Lori L
Bought by
Kuenzi Kristen M
Home Financials for this Owner
Home Financials are based on the most recent Mortgage that was taken out on this home.
Original Mortgage
$137,464
Interest Rate
4.75%
Mortgage Type
FHA
Purchase Details
Closed on
Apr 13, 2011
Sold by
Astin Matthew Raymond and Astin Laurel A
Bought by
Earley John W and Earley Lori L
Create a Home Valuation Report for This Property
The Home Valuation Report is an in-depth analysis detailing your home's value as well as a comparison with similar homes in the area
Home Values in the Area
Average Home Value in this Area
Purchase History
| Date | Buyer | Sale Price | Title Company |
|---|---|---|---|
| Craft Karell | $263,000 | None Listed On Document | |
| Craft Karell | $263,000 | None Listed On Document | |
| Kuenzi Kristen M | $140,000 | None Available | |
| Earley John W | $165,000 | None Available |
Source: Public Records
Mortgage History
| Date | Status | Borrower | Loan Amount |
|---|---|---|---|
| Open | Craft Karell | $258,236 | |
| Closed | Craft Karell | $258,236 | |
| Previous Owner | Kuenzi Kristen M | $137,464 |
Source: Public Records
Tax History Compared to Growth
Tax History
| Year | Tax Paid | Tax Assessment Tax Assessment Total Assessment is a certain percentage of the fair market value that is determined by local assessors to be the total taxable value of land and additions on the property. | Land | Improvement |
|---|---|---|---|---|
| 2025 | $2,338 | $196,637 | $47,046 | $149,591 |
| 2024 | $2,302 | $194,500 | $47,046 | $147,454 |
| 2023 | $2,085 | $158,304 | $47,046 | $111,258 |
| 2022 | $2,073 | $158,304 | $47,046 | $111,258 |
| 2021 | $2,073 | $158,304 | $47,046 | $111,258 |
| 2020 | $1,294 | $158,304 | $47,046 | $111,258 |
| 2019 | $1,294 | $157,055 | $47,046 | $110,009 |
| 2018 | $1,236 | $157,055 | $47,046 | $110,009 |
| 2017 | $1,236 | $157,055 | $47,046 | $110,009 |
| 2016 | $1,154 | $157,055 | $47,046 | $110,009 |
| 2015 | $1,154 | $149,221 | $47,046 | $102,175 |
| 2014 | $1,154 | $149,221 | $47,046 | $102,175 |
Source: Public Records
Map
Nearby Homes
- 3813 W Wilson St
- 4300 Belcher St
- 3842 W Wilson St
- 3846 W Wilson St
- 4225 E Church St
- 4365 W Pine St Unit B
- 4365 W Pine St Unit A
- 4371 W West Pine St Unit B
- 4371 W West Pine St Unit A
- 4367 W Pine St Unit A & B
- 3468 S George St
- 3902 W Wilson St
- 4252 Pinehurst Ct
- 4266 Pinehurst Ct
- 4424 W Moore St
- 4121 Grimmersburg St
- 4320 Wallace St
- 3348 N Pitt St
- 4085 Grimmersburg St
- 3209 N Waverly St
- 3770 West Wilson St
- 3776 W West Wilson St
- 3776 W Wilson St
- 3782 West Wilson St
- 3359 North George St
- 3355 North George St
- 3783 West Wilson St
- 3783 Wilson St W
- 3343 N George St Unit A
- 3343 N George St Unit B
- 3343 North George St
- 3350 North George St
- 3804 Wilson St W
- 3804 West Wilson St
- 3342 N George St
- 3799 West Wilson St
- 3342 North George St
- 4291 Belcher St
- 4266 Belcher St
- 3805 West Wilson St