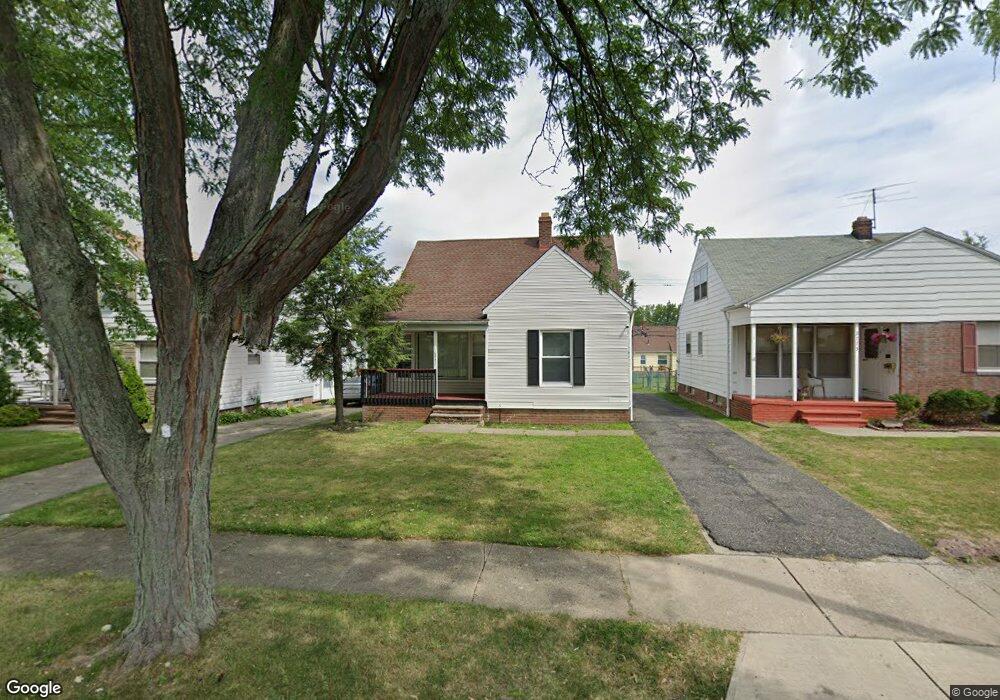
3771 Salisbury Rd Cleveland, OH 44121
Estimated Value: $127,710 - $182,000
2
Beds
1
Bath
1,302
Sq Ft
$113/Sq Ft
Est. Value
About This Home
This home is located at 3771 Salisbury Rd, Cleveland, OH 44121 and is currently estimated at $147,428, approximately $113 per square foot. 3771 Salisbury Rd is a home located in Cuyahoga County with nearby schools including Adrian Elementary School, Greenview Upper Elementary School, and Memorial Junior High School.
Ownership History
Date
Name
Owned For
Owner Type
Purchase Details
Closed on
Nov 24, 2024
Sold by
Gorelick Investment Group V Llc
Bought by
Th Property Owner I Llc
Current Estimated Value
Purchase Details
Closed on
Jun 1, 2023
Sold by
Gorelick Investment Group Iii Llc
Bought by
Gorelick Investment Group V Llc
Purchase Details
Closed on
Feb 27, 2019
Sold by
Horizon Enterprises Llc
Bought by
Gorelick Investment Group Iii Llc
Purchase Details
Closed on
Aug 10, 2012
Sold by
Horizon Enterprises
Bought by
Horizo Enterprises Llc
Purchase Details
Closed on
May 7, 1986
Sold by
Tantanella Helen
Bought by
Horizon Enterprises
Purchase Details
Closed on
Feb 18, 1986
Sold by
Galier Peter Q
Bought by
Tantanella Helen
Purchase Details
Closed on
Jan 1, 1975
Bought by
Galier Peter Q
Create a Home Valuation Report for This Property
The Home Valuation Report is an in-depth analysis detailing your home's value as well as a comparison with similar homes in the area
Home Values in the Area
Average Home Value in this Area
Purchase History
| Date | Buyer | Sale Price | Title Company |
|---|---|---|---|
| Th Property Owner I Llc | -- | Ohio Real Title | |
| Th Property Owner I Llc | -- | Ohio Real Title | |
| Gorelick Investment Group V Llc | -- | Ohio Real Title | |
| Gorelick Investment Group Iii Llc | $53,000 | Greater Cleveland Title | |
| Horizo Enterprises Llc | -- | Attorney | |
| Horizon Enterprises | $37,000 | -- | |
| Tantanella Helen | -- | -- | |
| Galier Peter Q | -- | -- |
Source: Public Records
Tax History Compared to Growth
Tax History
| Year | Tax Paid | Tax Assessment Tax Assessment Total Assessment is a certain percentage of the fair market value that is determined by local assessors to be the total taxable value of land and additions on the property. | Land | Improvement |
|---|---|---|---|---|
| 2024 | $3,182 | $39,550 | $8,610 | $30,940 |
| 2023 | $2,328 | $22,820 | $6,790 | $16,030 |
| 2022 | $2,316 | $22,820 | $6,790 | $16,030 |
| 2021 | $2,300 | $22,820 | $6,790 | $16,030 |
| 2020 | $2,158 | $18,550 | $5,530 | $13,020 |
| 2019 | $2,655 | $73,600 | $15,800 | $57,800 |
| 2018 | $2,575 | $25,760 | $5,530 | $20,230 |
| 2017 | $2,583 | $23,030 | $4,270 | $18,760 |
| 2016 | $2,567 | $23,030 | $4,270 | $18,760 |
| 2015 | $2,612 | $23,030 | $4,270 | $18,760 |
| 2014 | $2,612 | $24,260 | $4,480 | $19,780 |
Source: Public Records
Map
Nearby Homes
- 3778 Salisbury Rd
- 3811 Salisbury Rd
- 772 Quilliams Rd
- 693 Quilliams Rd
- 858 Roanoke Rd
- 3867 Covington Rd
- 855 Roanoke Rd
- 3780 Lowell Rd
- 3655 Langton Rd
- 3927 Princeton Blvd
- 3598 Atherstone Rd
- 939 Vineshire Rd
- 3609 Langton Rd
- 931 Yellowstone Rd
- 915 Clarence Rd
- 3547 Randolph Rd
- 565 Quilliams Rd
- 891 Medford Rd
- 3803 Bridgeview Dr
- 2440 Noble Rd Unit 208
- 3775 Salisbury Rd
- 3767 Salisbury Rd
- 3779 Salisbury Rd
- 3763 Salisbury Rd
- 3772 Wallingford Rd
- 3783 Salisbury Rd
- 3776 Wallingford Rd
- 3766 Wallingford Rd
- 3759 Salisbury Rd
- 3782 Wallingford Rd
- 3762 Wallingford Rd
- 3787 Salisbury Rd
- 3770 Salisbury Rd
- 3774 Salisbury Rd
- 3766 Salisbury Rd
- 3755 Salisbury Rd
- 3786 Wallingford Rd
- 3762 Salisbury Rd
- 3756 Wallingford Rd
- 3791 Salisbury Rd