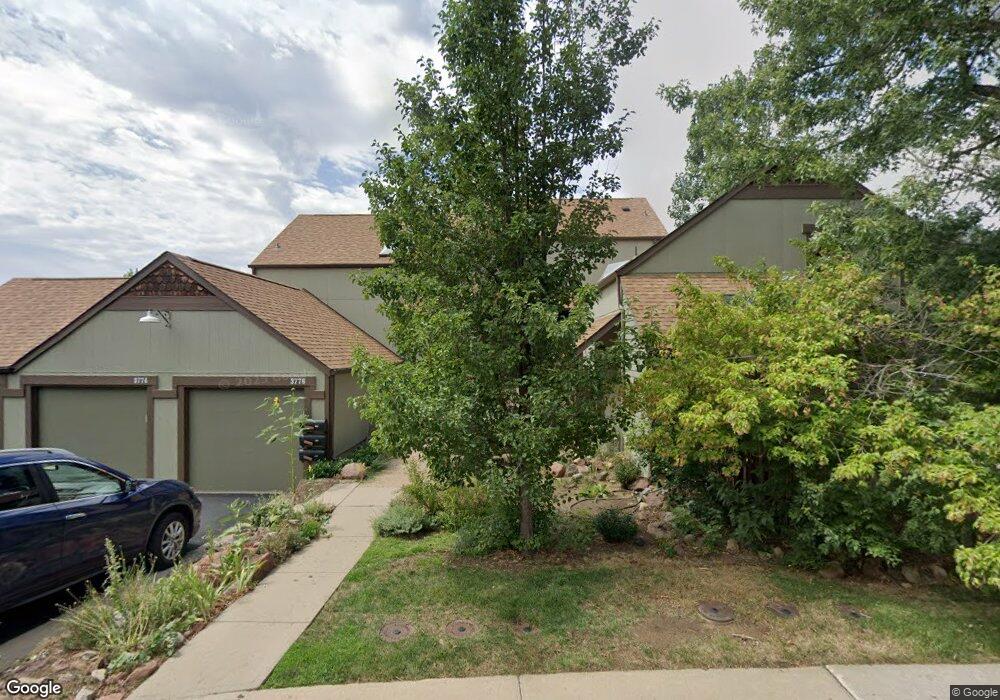
3772 Telluride Cir Boulder, CO 80305
Table Mesa NeighborhoodEstimated Value: $838,942 - $939,000
3
Beds
2
Baths
1,320
Sq Ft
$672/Sq Ft
Est. Value
About This Home
This home is located at 3772 Telluride Cir, Boulder, CO 80305 and is currently estimated at $887,486, approximately $672 per square foot. 3772 Telluride Cir is a home located in Boulder County with nearby schools including Mesa Elementary School, Southern Hills Middle School, and Fairview High School.
Ownership History
Date
Name
Owned For
Owner Type
Purchase Details
Closed on
Oct 28, 2019
Sold by
Claghorn Scott
Bought by
Mark Arams Trust
Current Estimated Value
Purchase Details
Closed on
Nov 30, 2018
Sold by
Bnd Investments Llc
Bought by
Scott Clagori
Home Financials for this Owner
Home Financials are based on the most recent Mortgage that was taken out on this home.
Original Mortgage
$350,000
Interest Rate
4.37%
Mortgage Type
Adjustable Rate Mortgage/ARM
Purchase Details
Closed on
Dec 7, 2016
Sold by
Rogalla Horst and Rogalla Erna
Bought by
Bnd Investments Llc
Purchase Details
Closed on
Aug 27, 2003
Sold by
Baskin Renita
Bought by
Rogalla Horst
Purchase Details
Closed on
May 1, 1987
Bought by
Bnd Investments Llc
Purchase Details
Closed on
Nov 19, 1986
Bought by
Bnd Investments Llc
Purchase Details
Closed on
Jul 1, 1983
Bought by
Bnd Investments Llc
Purchase Details
Closed on
Sep 16, 1977
Bought by
Bnd Investments Llc
Create a Home Valuation Report for This Property
The Home Valuation Report is an in-depth analysis detailing your home's value as well as a comparison with similar homes in the area
Home Values in the Area
Average Home Value in this Area
Purchase History
| Date | Buyer | Sale Price | Title Company |
|---|---|---|---|
| Mark Arams Trust | $725,000 | Land Title Guarantee | |
| Scott Clagori | $670,000 | Land Title Guarantee Co | |
| Bnd Investments Llc | $545,000 | Fidelity National Title | |
| Rogalla Horst | $330,000 | Land Title | |
| Bnd Investments Llc | -- | -- | |
| Bnd Investments Llc | -- | -- | |
| Bnd Investments Llc | $83,500 | -- | |
| Bnd Investments Llc | $44,100 | -- |
Source: Public Records
Mortgage History
| Date | Status | Borrower | Loan Amount |
|---|---|---|---|
| Previous Owner | Scott Clagori | $350,000 |
Source: Public Records
Tax History Compared to Growth
Tax History
| Year | Tax Paid | Tax Assessment Tax Assessment Total Assessment is a certain percentage of the fair market value that is determined by local assessors to be the total taxable value of land and additions on the property. | Land | Improvement |
|---|---|---|---|---|
| 2025 | $5,143 | $56,844 | $26,956 | $29,888 |
| 2024 | $5,143 | $56,844 | $26,956 | $29,888 |
| 2023 | $5,054 | $58,525 | $30,954 | $31,256 |
| 2022 | $4,759 | $51,249 | $23,880 | $27,369 |
| 2021 | $4,538 | $52,724 | $24,567 | $28,157 |
| 2020 | $3,747 | $43,050 | $24,310 | $18,740 |
| 2019 | $3,690 | $43,050 | $24,310 | $18,740 |
| 2018 | $3,424 | $39,492 | $23,688 | $15,804 |
| 2017 | $3,317 | $43,660 | $26,188 | $17,472 |
| 2016 | $2,918 | $33,703 | $21,094 | $12,609 |
| 2015 | $2,763 | $29,603 | $12,338 | $17,265 |
| 2014 | $2,489 | $29,603 | $12,338 | $17,265 |
Source: Public Records
Map
Nearby Homes
- 3760 Smuggler Place
- 3433 Cripple Creek Square Unit G16
- 3394 Cripple Creek Trail Unit H15
- 3387 Cripple Creek Trail Unit F14
- 3391 Cripple Creek Trail Unit E
- 3970 Longwood Ave
- 3196 Galena Way
- 4238 Greenbriar Blvd
- 4204 Greenbriar Blvd Unit 45
- 2665 Juilliard St
- 1535 Findlay Way
- 3450 Emerson Ave
- 1596 Bradley Dr Unit 105C
- 1720 S Marshall Rd Unit 41
- 1720 S Marshall Rd Unit 26
- 4350 Butler Cir
- 4630 MacKy Way
- 1120 Hartford Dr
- 2880 La Grange Cir
- 960 Toedtli Dr
- 3772 Telluride Ln
- 3774 Telluride Ln
- 3774 Telluride Ln
- 3776 Telluride Ln
- 3789 Telluride Cir
- 3782 Telluride Ln
- 3764 Telluride Ln
- 3764 Telluride Cir
- 3786 Telluride Cir
- 3744 Telluride Ln
- 3784 Telluride Ln
- 3871 Greenbriar Blvd
- 3796 Telluride Ln
- 3725 Smuggler Place
- 1890 Telluride Ln
- 3792 Telluride Ln
- 3735 Smuggler Place
- 3768 Telluride Cir
- 3700 Telluride Cir
- 1880 Telluride Ln