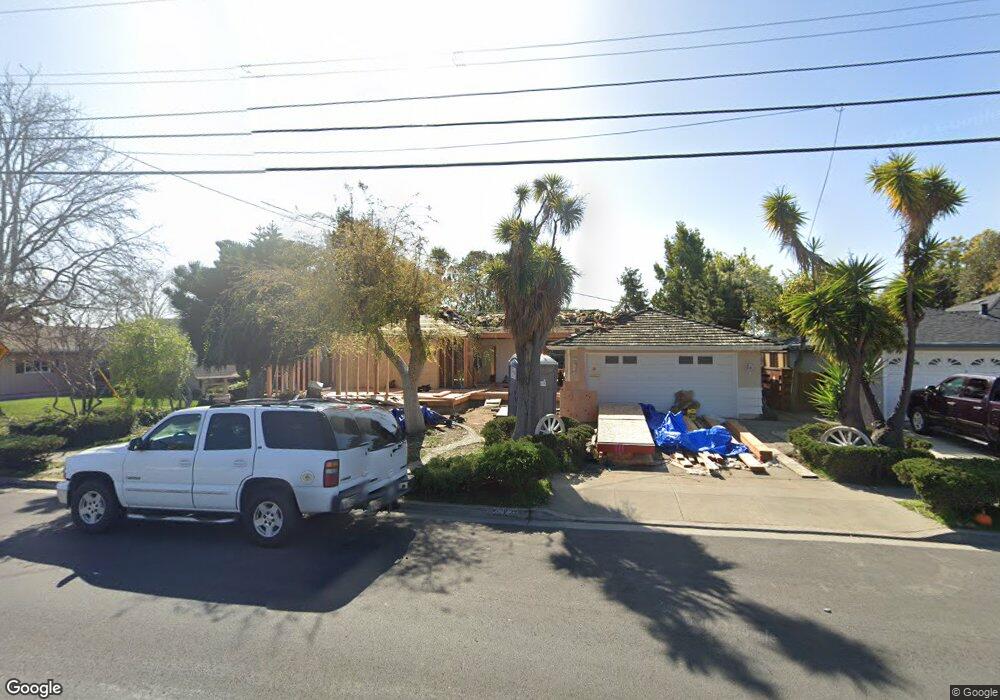
37721 Farwell Dr Fremont, CA 94536
Glenmoor NeighborhoodEstimated Value: $1,443,577 - $1,626,000
3
Beds
2
Baths
1,329
Sq Ft
$1,186/Sq Ft
Est. Value
About This Home
This home is located at 37721 Farwell Dr, Fremont, CA 94536 and is currently estimated at $1,575,644, approximately $1,185 per square foot. 37721 Farwell Dr is a home located in Alameda County with nearby schools including John G. Mattos Elementary School, G.M. Walters Middle School, and John F. Kennedy High School.
Ownership History
Date
Name
Owned For
Owner Type
Purchase Details
Closed on
Aug 5, 2016
Sold by
Kennerson Teixeira Linda Carol and Andrade Jeffrey Ernest
Bought by
Das Tapas T and Bhandakkar Geeta R
Current Estimated Value
Home Financials for this Owner
Home Financials are based on the most recent Mortgage that was taken out on this home.
Original Mortgage
$620,000
Outstanding Balance
$494,688
Interest Rate
3.48%
Mortgage Type
New Conventional
Estimated Equity
$1,080,956
Purchase Details
Closed on
Apr 5, 2016
Sold by
Andrade Carol Celeste
Bought by
Carol Celeste Andrade Living Trust
Purchase Details
Closed on
Dec 10, 2013
Sold by
Kennerson Teixeira Linda Carol and Andrade Jeffrey Ernest
Bought by
Kennerson Teixeira Linda Carol and Andrade Jeffrey Ernest
Purchase Details
Closed on
Aug 4, 2010
Sold by
Andrade Carol Celeste
Bought by
Andrade Carol Celeste and Carol Celeste Andrade Living T
Purchase Details
Closed on
Jun 20, 1994
Sold by
Andrade Ernest R and Andrade Carol C
Bought by
Andrade Ernest R and Andrade Carol C
Create a Home Valuation Report for This Property
The Home Valuation Report is an in-depth analysis detailing your home's value as well as a comparison with similar homes in the area
Home Values in the Area
Average Home Value in this Area
Purchase History
| Date | Buyer | Sale Price | Title Company |
|---|---|---|---|
| Das Tapas T | $775,000 | Chicago Title Company | |
| Carol Celeste Andrade Living Trust | -- | None Available | |
| Kennerson Teixeira Linda Carol | -- | None Available | |
| Kennerson Teixeira Linda Carol | -- | None Available | |
| Andrade Carol Celeste | -- | None Available | |
| Andrade Ernest R | -- | Golden Bay Title |
Source: Public Records
Mortgage History
| Date | Status | Borrower | Loan Amount |
|---|---|---|---|
| Open | Das Tapas T | $620,000 |
Source: Public Records
Tax History Compared to Growth
Tax History
| Year | Tax Paid | Tax Assessment Tax Assessment Total Assessment is a certain percentage of the fair market value that is determined by local assessors to be the total taxable value of land and additions on the property. | Land | Improvement |
|---|---|---|---|---|
| 2025 | $12,292 | $1,074,433 | $269,830 | $811,603 |
| 2024 | $12,292 | $1,012,601 | $264,540 | $755,061 |
| 2023 | $10,444 | $864,511 | $259,353 | $605,158 |
| 2022 | $10,310 | $840,562 | $254,268 | $593,294 |
| 2021 | $10,056 | $823,947 | $249,284 | $581,663 |
| 2020 | $10,090 | $822,430 | $246,729 | $575,701 |
| 2019 | $9,974 | $806,310 | $241,893 | $564,417 |
| 2018 | $9,779 | $790,500 | $237,150 | $553,350 |
| 2017 | $9,534 | $775,000 | $232,500 | $542,500 |
| 2016 | $1,356 | $74,422 | $26,717 | $47,705 |
| 2015 | $1,323 | $73,304 | $26,316 | $46,988 |
| 2014 | $1,288 | $71,869 | $25,801 | $46,068 |
Source: Public Records
Map
Nearby Homes
- 5268 Keeler Ct
- 37659 Granville Dr
- 37792 Colfax Ct
- 5169 Lawler Ave
- 37987 Alta Dr
- 37721 Madera Ct
- 38324 Blacow Rd
- 5859 Central Ave
- Rosario Plan at Marabel
- Ronda Plan at Marabel
- Sidonia Plan at Marabel
- Sierra Plan at Marabel
- Medina Plan at Marabel
- Olvera Plan at Marabel
- 5669 Civic Terrace Ave
- 4737 Deadwood Dr
- 38466 Ambrosia St
- 38496 Ambrosia St
- 38532 Cedar Blvd
- 38393 Amaryllis Place
- 37739 Farwell Dr
- 37703 Farwell Dr
- 37712 Granville Dr
- 37757 Farwell Dr
- 5383 Granville Ct
- 37660 Granville Dr
- 5363 Granville Ct
- 37645 Farwell Dr
- 37706 Farwell Dr
- 37640 Granville Dr
- 37724 Farwell Dr
- 37775 Farwell Dr
- 37742 Farwell Dr
- 37732 Granville Dr
- 37656 Farwell Dr
- 5284 Keeler Ct
- 5354 Granville Ct
- 37760 Farwell Dr
- 37793 Farwell Dr
- 5374 Granville Ct