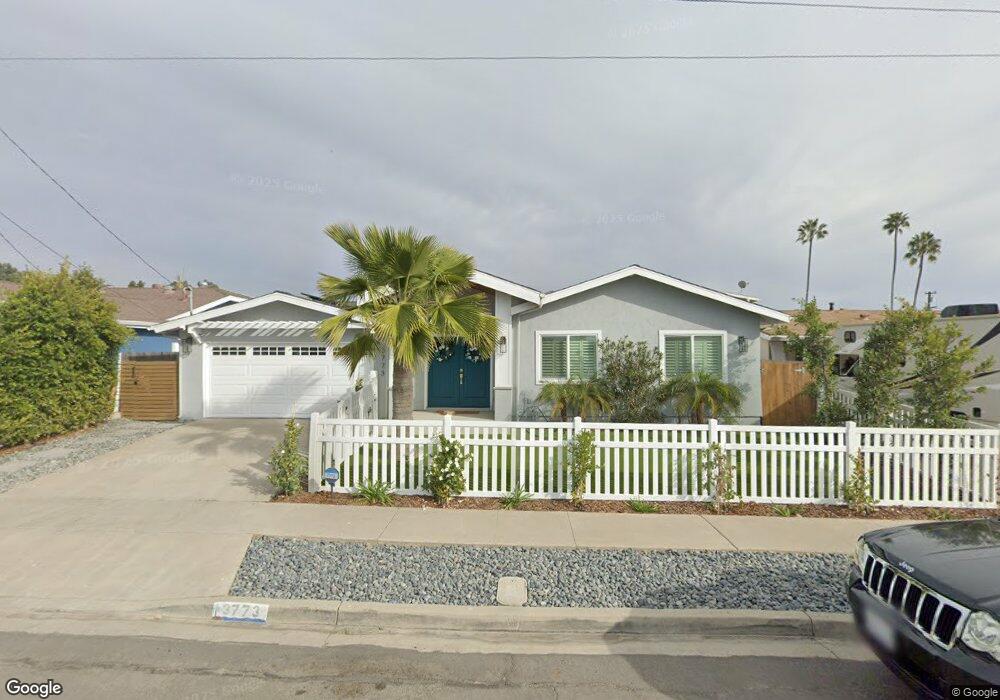
3773 Cameo Ln San Diego, CA 92111
Clairemont Mesa West NeighborhoodEstimated Value: $996,000 - $1,260,599
3
Beds
2
Baths
1,249
Sq Ft
$923/Sq Ft
Est. Value
About This Home
This home is located at 3773 Cameo Ln, San Diego, CA 92111 and is currently estimated at $1,152,400, approximately $922 per square foot. 3773 Cameo Ln is a home located in San Diego County with nearby schools including Holmes Elementary, Marston Middle School, and Clairemont High School.
Ownership History
Date
Name
Owned For
Owner Type
Purchase Details
Closed on
Sep 13, 2018
Sold by
Brock Mitzi L and The Cameo Trust
Bought by
Rodriguez Osmar and Rodriguez Alyssa
Current Estimated Value
Home Financials for this Owner
Home Financials are based on the most recent Mortgage that was taken out on this home.
Original Mortgage
$571,450
Outstanding Balance
$497,312
Interest Rate
4.5%
Mortgage Type
New Conventional
Estimated Equity
$655,088
Purchase Details
Closed on
Jul 19, 2018
Sold by
Larsen Ronald R and Larsen Raymond L
Bought by
Brock Mitzi L and The Cameo Trust
Home Financials for this Owner
Home Financials are based on the most recent Mortgage that was taken out on this home.
Original Mortgage
$571,450
Outstanding Balance
$497,312
Interest Rate
4.5%
Mortgage Type
New Conventional
Estimated Equity
$655,088
Purchase Details
Closed on
Mar 20, 2009
Sold by
Larsen Raymond Delbert and Larsen Theresa E
Bought by
Larsen Raymond D and Larsen Theresa E
Create a Home Valuation Report for This Property
The Home Valuation Report is an in-depth analysis detailing your home's value as well as a comparison with similar homes in the area
Home Values in the Area
Average Home Value in this Area
Purchase History
| Date | Buyer | Sale Price | Title Company |
|---|---|---|---|
| Rodriguez Osmar | $635,500 | Lawyers Title Company | |
| Brock Mitzi L | $475,000 | Lawyers Title Company | |
| Larsen Raymond D | -- | None Available |
Source: Public Records
Mortgage History
| Date | Status | Borrower | Loan Amount |
|---|---|---|---|
| Open | Rodriguez Osmar | $571,450 |
Source: Public Records
Tax History Compared to Growth
Tax History
| Year | Tax Paid | Tax Assessment Tax Assessment Total Assessment is a certain percentage of the fair market value that is determined by local assessors to be the total taxable value of land and additions on the property. | Land | Improvement |
|---|---|---|---|---|
| 2025 | $9,780 | $809,386 | $557,756 | $251,630 |
| 2024 | $9,780 | $793,517 | $546,820 | $246,697 |
| 2023 | $9,564 | $777,959 | $536,099 | $241,860 |
| 2022 | $9,128 | $747,706 | $525,588 | $222,118 |
| 2021 | $8,099 | $654,615 | $515,283 | $139,332 |
| 2020 | $8,001 | $647,904 | $510,000 | $137,904 |
| 2019 | $7,858 | $635,200 | $500,000 | $135,200 |
| 2018 | $613 | $56,394 | $17,640 | $38,754 |
| 2017 | $596 | $55,290 | $17,295 | $37,995 |
| 2016 | $584 | $54,206 | $16,956 | $37,250 |
| 2015 | $574 | $53,393 | $16,702 | $36,691 |
| 2014 | $565 | $52,348 | $16,375 | $35,973 |
Source: Public Records
Map
Nearby Homes
- 3942 Mount Acadia Blvd
- 3635 Mount Abbey Ave
- 3855 Mount Blackburn Ave
- 5252 Mount Blanca Dr
- 3581 Mount Abbey Ave
- 3526 Mount Abbey Ave
- 3567 Mount Everest Blvd
- 5581 Mount Acara Dr
- 3516 Old Cobble Rd
- 5273 Mount Alifan Dr
- 5507 Caminito Roberto
- 5696 Caminito Roberto
- 5289 Mount Alifan Dr
- 3710 Old Cobble Rd
- 5606 Caminito Roberto
- 3816 Mount Abraham Ave
- 4182 Mount Alifan Place Unit G
- 4870 Mount Armour Dr
- 5230 Mount Alifan Dr
- 3270 W Fox Run Way Unit 2
- 3781 Cameo Ln
- 3765 Cameo Ln
- 3772 Mount Aladin Ave
- 3782 Mount Aladin Ave
- 3762 Mount Aladin Ave
- 3757 Cameo Ln
- 5341 Mount Ararat Dr
- 3772 Cameo Ln
- 3792 Mount Aladin Ave
- 3752 Mount Aladin Ave
- 3764 Cameo Ln
- 3749 Cameo Ln
- 3756 Cameo Ln
- 5277 Mount Ararat Dr
- 3742 Mount Aladin Ave
- 3748 Cameo Ln
- 3771 Mount Aladin Ave
- 3743 Cameo Ln
- 5340 Mount Ararat Dr