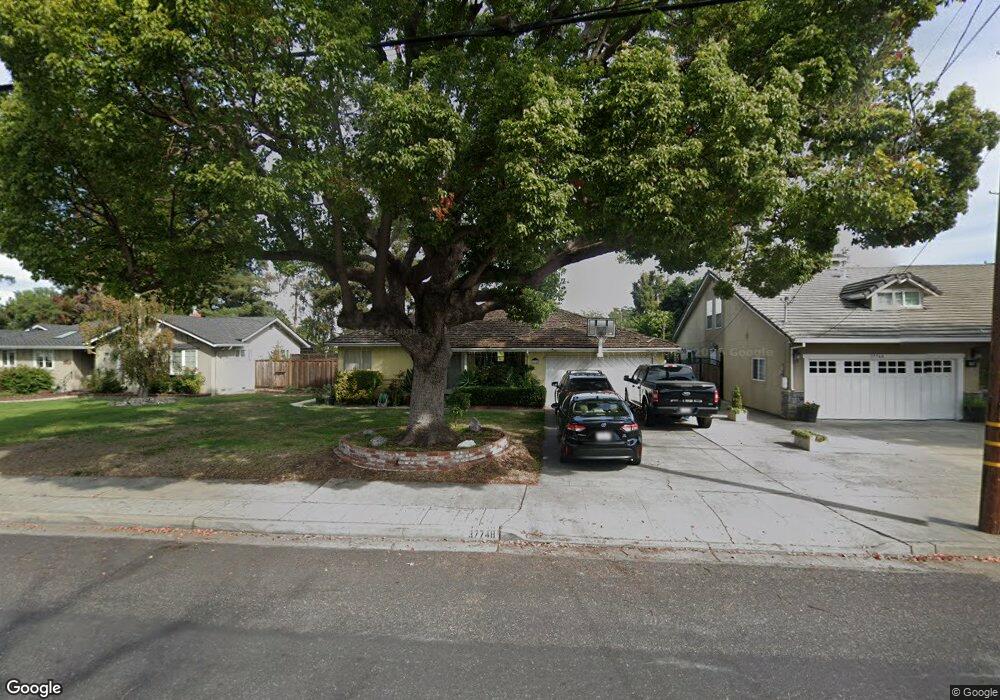
37748 Glenmoor Dr Fremont, CA 94536
Glenmoor NeighborhoodEstimated Value: $1,244,000 - $1,352,000
3
Beds
1
Bath
1,107
Sq Ft
$1,188/Sq Ft
Est. Value
About This Home
This home is located at 37748 Glenmoor Dr, Fremont, CA 94536 and is currently estimated at $1,314,828, approximately $1,187 per square foot. 37748 Glenmoor Dr is a home located in Alameda County with nearby schools including Glenmoor Elementary School, Centerville Junior High School, and Washington High School.
Ownership History
Date
Name
Owned For
Owner Type
Purchase Details
Closed on
Jun 6, 2018
Sold by
Sharma Man Mohan and Sharma Neera
Bought by
Sharma Man Mohan and Sharma Neera
Current Estimated Value
Purchase Details
Closed on
Mar 30, 2011
Sold by
Sharma Man Mohan and Sharma Mohan
Bought by
Sharma Man Mohan and Sharma Neera
Purchase Details
Closed on
Mar 29, 2011
Sold by
Elgin Steven Joseph
Bought by
Sharma Mohan
Purchase Details
Closed on
May 1, 2002
Sold by
Hiltabidel Eunice M and Eunice M Hiltabidel Revocable
Bought by
Elgin Steven Joseph
Home Financials for this Owner
Home Financials are based on the most recent Mortgage that was taken out on this home.
Original Mortgage
$380,000
Interest Rate
7.18%
Purchase Details
Closed on
Jan 19, 1994
Sold by
Hiltabidel Eunice M
Bought by
Hiltabidel Eunice M
Create a Home Valuation Report for This Property
The Home Valuation Report is an in-depth analysis detailing your home's value as well as a comparison with similar homes in the area
Home Values in the Area
Average Home Value in this Area
Purchase History
| Date | Buyer | Sale Price | Title Company |
|---|---|---|---|
| Sharma Man Mohan | -- | None Available | |
| Sharma Man Mohan | -- | None Available | |
| Sharma Mohan | $374,000 | Orange Coast Title Company | |
| Elgin Steven Joseph | $475,000 | Old Republic Title Company | |
| Hiltabidel Eunice M | -- | -- |
Source: Public Records
Mortgage History
| Date | Status | Borrower | Loan Amount |
|---|---|---|---|
| Previous Owner | Elgin Steven Joseph | $380,000 | |
| Closed | Elgin Steven Joseph | $95,000 |
Source: Public Records
Tax History Compared to Growth
Tax History
| Year | Tax Paid | Tax Assessment Tax Assessment Total Assessment is a certain percentage of the fair market value that is determined by local assessors to be the total taxable value of land and additions on the property. | Land | Improvement |
|---|---|---|---|---|
| 2025 | $6,143 | $479,130 | $143,739 | $335,391 |
| 2024 | $6,143 | $469,740 | $140,922 | $328,818 |
| 2023 | $5,969 | $460,531 | $138,159 | $322,372 |
| 2022 | $5,879 | $451,503 | $135,451 | $316,052 |
| 2021 | $5,739 | $442,651 | $132,795 | $309,856 |
| 2020 | $5,710 | $438,114 | $131,434 | $306,680 |
| 2019 | $5,648 | $429,527 | $128,858 | $300,669 |
| 2018 | $5,537 | $421,108 | $126,332 | $294,776 |
| 2017 | $5,399 | $412,854 | $123,856 | $288,998 |
| 2016 | $5,301 | $404,761 | $121,428 | $283,333 |
| 2015 | $5,225 | $398,683 | $119,605 | $279,078 |
| 2014 | $5,131 | $390,874 | $117,262 | $273,612 |
Source: Public Records
Map
Nearby Homes
- 4586 Norris Rd
- 37721 Madera Ct
- 4737 Deadwood Dr
- 4715 Eggers Dr
- 37987 Alta Dr
- 38324 Blacow Rd
- 4637 Rothbury Common
- 37792 Colfax Ct
- 38265 Corrigan Ct
- 4328 Cognina Ct
- 37114 Dondero Way
- 5169 Lawler Ave
- 37001 Contra Costa Ave
- 4754 Northdale Dr
- Plan 1629 at Veranda
- Plan 1165 at Veranda
- Plan 1670 at Veranda
- Plan 1455 at Veranda
- Plan 1394 at Veranda
- Plan 1725 at Veranda
- 37732 Glenmoor Dr
- 37764 Glenmoor Dr
- 37716 Glenmoor Dr
- 4581 Faulkner Ct
- 37780 Glenmoor Dr
- 4580 Faulkner Ct
- 37682 Glenmoor Dr
- 37751 Glenmoor Dr
- 4582 Darrow Ct
- 37735 Glenmoor Dr
- 37767 Glenmoor Dr
- 37719 Glenmoor Dr
- 4565 Faulkner Ct
- 37666 Glenmoor Dr
- 37783 Glenmoor Dr
- 4564 Faulkner Ct
- 4565 Logan Ct
- 37685 Glenmoor Dr
- 37834 Glenmoor Dr
- 4566 Darrow Ct