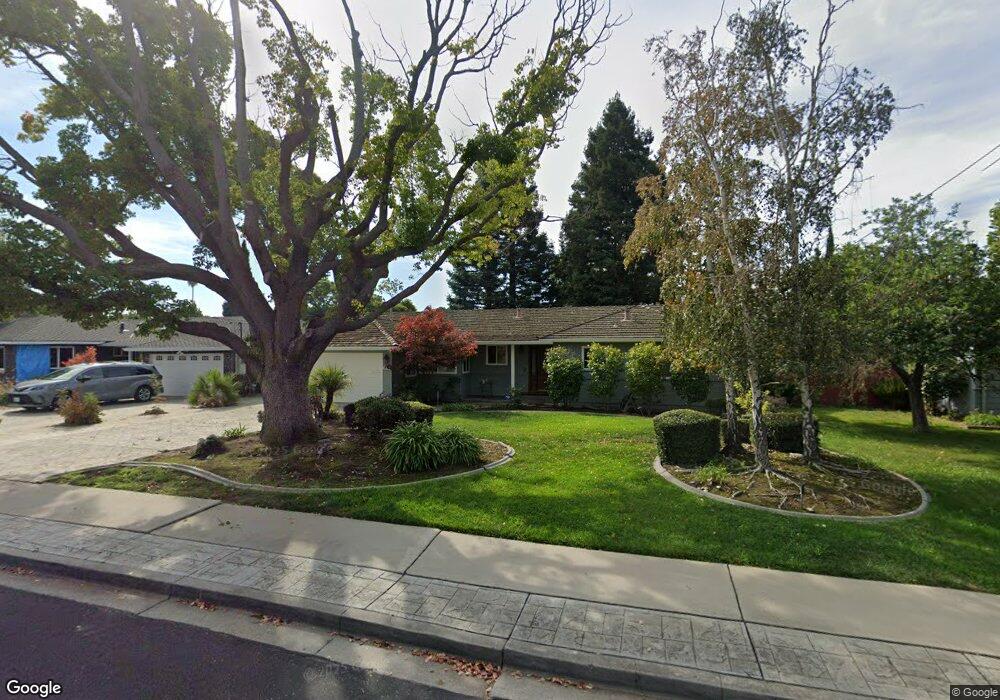
37751 Glenmoor Dr Fremont, CA 94536
Glenmoor NeighborhoodEstimated Value: $1,622,000 - $1,843,000
3
Beds
2
Baths
1,664
Sq Ft
$1,032/Sq Ft
Est. Value
About This Home
This home is located at 37751 Glenmoor Dr, Fremont, CA 94536 and is currently estimated at $1,716,486, approximately $1,031 per square foot. 37751 Glenmoor Dr is a home located in Alameda County with nearby schools including Glenmoor Elementary School, Centerville Junior High School, and Washington High School.
Ownership History
Date
Name
Owned For
Owner Type
Purchase Details
Closed on
Dec 17, 2010
Sold by
Liu Jonathan
Bought by
Liu Jonathan and The Jonathan Liu 2010 Trust
Current Estimated Value
Purchase Details
Closed on
Apr 20, 2010
Sold by
Long Loyd Gordon and Long Cariktb
Bought by
Liu Jonathan
Home Financials for this Owner
Home Financials are based on the most recent Mortgage that was taken out on this home.
Original Mortgage
$25,000
Outstanding Balance
$16,576
Interest Rate
4.91%
Mortgage Type
Balloon
Estimated Equity
$1,699,910
Purchase Details
Closed on
Sep 12, 1997
Sold by
Browne Dorothea J & James M Trust and James D
Bought by
Long Loyd Gordon and Long Carolyn
Home Financials for this Owner
Home Financials are based on the most recent Mortgage that was taken out on this home.
Original Mortgage
$256,000
Interest Rate
7.45%
Create a Home Valuation Report for This Property
The Home Valuation Report is an in-depth analysis detailing your home's value as well as a comparison with similar homes in the area
Home Values in the Area
Average Home Value in this Area
Purchase History
| Date | Buyer | Sale Price | Title Company |
|---|---|---|---|
| Liu Jonathan | -- | None Available | |
| Liu Jonathan | $705,000 | Fidelity National Title Co | |
| Long Loyd Gordon | $320,000 | Chicago Title Co |
Source: Public Records
Mortgage History
| Date | Status | Borrower | Loan Amount |
|---|---|---|---|
| Open | Liu Jonathan | $25,000 | |
| Previous Owner | Long Loyd Gordon | $256,000 | |
| Closed | Long Loyd Gordon | $32,000 |
Source: Public Records
Tax History Compared to Growth
Tax History
| Year | Tax Paid | Tax Assessment Tax Assessment Total Assessment is a certain percentage of the fair market value that is determined by local assessors to be the total taxable value of land and additions on the property. | Land | Improvement |
|---|---|---|---|---|
| 2025 | $10,927 | $909,964 | $272,989 | $636,975 |
| 2024 | $10,927 | $892,127 | $267,638 | $624,489 |
| 2023 | $10,637 | $874,636 | $262,391 | $612,245 |
| 2022 | $10,503 | $857,491 | $257,247 | $600,244 |
| 2021 | $10,245 | $840,684 | $252,205 | $588,479 |
| 2020 | $10,283 | $832,068 | $249,620 | $582,448 |
| 2019 | $10,166 | $815,754 | $244,726 | $571,028 |
| 2018 | $9,969 | $799,765 | $239,929 | $559,836 |
| 2017 | $9,721 | $784,086 | $235,226 | $548,860 |
| 2016 | $9,558 | $768,717 | $230,615 | $538,102 |
| 2015 | $9,433 | $757,176 | $227,153 | $530,023 |
| 2014 | $9,273 | $742,350 | $222,705 | $519,645 |
Source: Public Records
Map
Nearby Homes
- 4586 Norris Rd
- 37721 Madera Ct
- 4737 Deadwood Dr
- 4715 Eggers Dr
- 37987 Alta Dr
- 38324 Blacow Rd
- 4637 Rothbury Common
- 37792 Colfax Ct
- 38265 Corrigan Ct
- 4328 Cognina Ct
- 37114 Dondero Way
- 5169 Lawler Ave
- 37001 Contra Costa Ave
- 4754 Northdale Dr
- Plan 1629 at Veranda
- Plan 1165 at Veranda
- Plan 1670 at Veranda
- Plan 1455 at Veranda
- Plan 1394 at Veranda
- Plan 1725 at Veranda
- 37735 Glenmoor Dr
- 37767 Glenmoor Dr
- 37719 Glenmoor Dr
- 37746 Mosswood Dr
- 37783 Glenmoor Dr
- 37730 Mosswood Dr
- 37762 Mosswood Dr
- 37714 Mosswood Dr
- 37688 Mosswood Dr
- 37812 Mosswood Dr
- 37685 Glenmoor Dr
- 37748 Glenmoor Dr
- 37829 Glenmoor Dr
- 37764 Glenmoor Dr
- 37732 Glenmoor Dr
- 37828 Mosswood Dr
- 37716 Glenmoor Dr
- 37780 Glenmoor Dr
- 37672 Mosswood Dr
- 37669 Glenmoor Dr