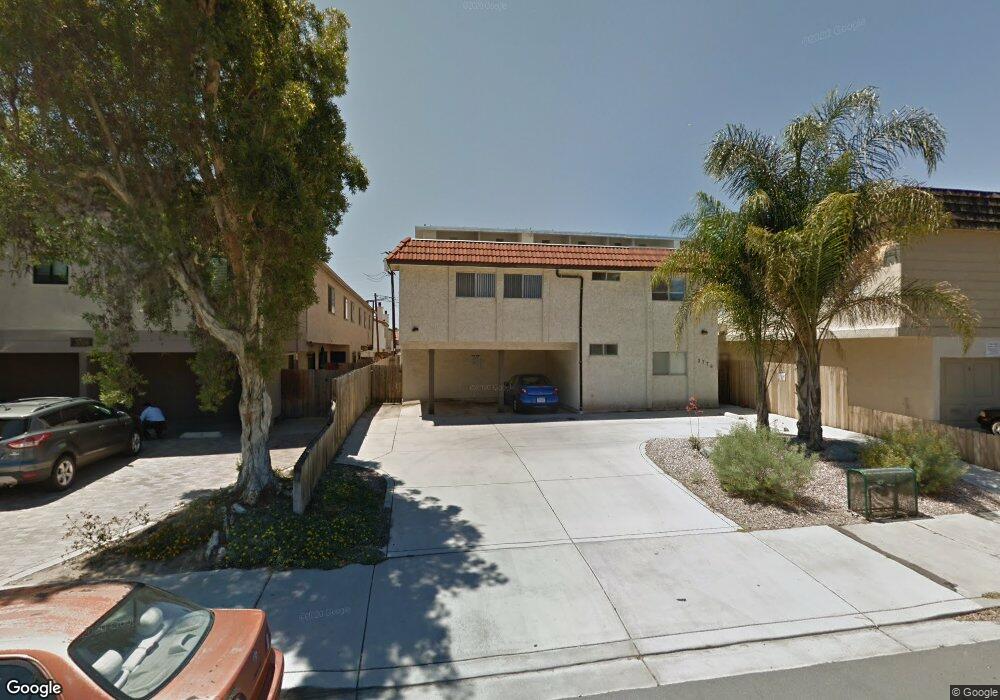
3776 31st St Unit 7 San Diego, CA 92104
North Park NeighborhoodEstimated Value: $519,000 - $589,584
2
Beds
2
Baths
768
Sq Ft
$730/Sq Ft
Est. Value
About This Home
This home is located at 3776 31st St Unit 7, San Diego, CA 92104 and is currently estimated at $560,896, approximately $730 per square foot. 3776 31st St Unit 7 is a home located in San Diego County with nearby schools including Jefferson Elementary, Roosevelt International Middle School, and North Park Christian School.
Ownership History
Date
Name
Owned For
Owner Type
Purchase Details
Closed on
May 4, 2006
Sold by
Diamond Liberty A
Bought by
Diamond Liberty A
Current Estimated Value
Purchase Details
Closed on
Nov 7, 2005
Sold by
Mangel George
Bought by
Diamond Liberty Ann
Purchase Details
Closed on
Aug 12, 1999
Sold by
Efrosini Mangel
Bought by
Mangel Efrosini
Purchase Details
Closed on
Feb 18, 1998
Sold by
Yirikian Martin
Bought by
Mangel Efrosini
Home Financials for this Owner
Home Financials are based on the most recent Mortgage that was taken out on this home.
Original Mortgage
$50,000
Outstanding Balance
$8,867
Interest Rate
7.02%
Estimated Equity
$552,029
Purchase Details
Closed on
Feb 12, 1998
Sold by
Matousek George W
Bought by
Mangel Efrosini
Home Financials for this Owner
Home Financials are based on the most recent Mortgage that was taken out on this home.
Original Mortgage
$50,000
Outstanding Balance
$8,867
Interest Rate
7.02%
Estimated Equity
$552,029
Create a Home Valuation Report for This Property
The Home Valuation Report is an in-depth analysis detailing your home's value as well as a comparison with similar homes in the area
Home Values in the Area
Average Home Value in this Area
Purchase History
| Date | Buyer | Sale Price | Title Company |
|---|---|---|---|
| Diamond Liberty A | -- | None Available | |
| Diamond Liberty Ann | -- | -- | |
| Mangel Efrosini | -- | -- | |
| Mangel Efrosini | -- | Fidelity National Title Co | |
| Mangel Efrosini | $55,000 | Fidelity National Title Co |
Source: Public Records
Mortgage History
| Date | Status | Borrower | Loan Amount |
|---|---|---|---|
| Open | Mangel Efrosini | $50,000 |
Source: Public Records
Tax History Compared to Growth
Tax History
| Year | Tax Paid | Tax Assessment Tax Assessment Total Assessment is a certain percentage of the fair market value that is determined by local assessors to be the total taxable value of land and additions on the property. | Land | Improvement |
|---|---|---|---|---|
| 2025 | $6,095 | $501,766 | $348,449 | $153,317 |
| 2024 | $6,095 | $491,928 | $341,617 | $150,311 |
| 2023 | $5,961 | $482,283 | $334,919 | $147,364 |
| 2022 | $5,801 | $375,000 | $258,000 | $117,000 |
| 2021 | $4,583 | $375,000 | $258,000 | $117,000 |
| 2020 | $4,267 | $350,000 | $241,000 | $109,000 |
| 2019 | $4,274 | $350,000 | $241,000 | $109,000 |
| 2018 | $3,841 | $330,000 | $228,000 | $102,000 |
| 2017 | $3,824 | $330,000 | $228,000 | $102,000 |
| 2016 | $3,838 | $330,000 | $228,000 | $102,000 |
| 2015 | $3,192 | $275,000 | $190,000 | $85,000 |
| 2014 | $2,674 | $230,000 | $159,000 | $71,000 |
Source: Public Records
Map
Nearby Homes
- 3780 32nd St
- 3939 Illinois St Unit 1C
- 3167 Landis St
- 3950 Ohio St Unit 507
- 3950 Ohio St Unit 226
- 3957 30th St Unit 319
- 4030 Ohio St
- 2828 University Ave Unit 503
- 0 Boundary St Unit SB25155904
- 3946 Utah St Unit 3
- 4074 30th St
- 3970 Utah St Unit 9
- 3509-11 32nd St
- 4043 Utah St Unit 3
- 4043 Utah St Unit 8
- 3660 28th St
- 3410 Grim Ave
- 4119-23 Kansas
- 3780 Swift Ave Unit 3
- 4170 33rd St Unit 204
- 3776 31st St Unit 6
- 3776 31st St Unit 5
- 3776 31st St Unit 4
- 3776 31st St Unit 3
- 3776 31st St Unit 2
- 3776 31st St Unit 1
- 3766 31st St
- 3766 31st St Unit 4
- 3766 31st St Unit 3
- 3766 31st St Unit 2
- 3766 31st St Unit 1
- 3766 31st St Unit 8
- 3766 31st St Unit 7
- 3766 31st St Unit 6
- 3766 31st St Unit 5
- 3792 31st St
- 3792 31st St
- 3758 31st St
- 3767 Grim Ave Unit 6
- 3767 Grim Ave Unit 5