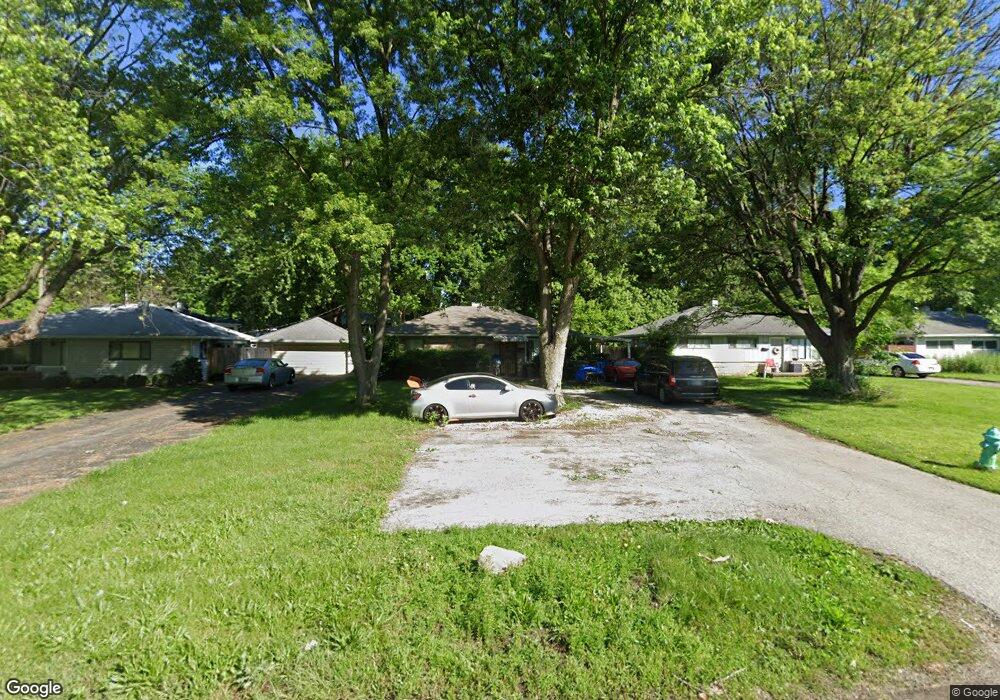
3776 E Pleasant Run Parkway North Dr Indianapolis, IN 46201
Christian Park NeighborhoodEstimated Value: $91,000 - $154,000
3
Beds
1
Bath
1,280
Sq Ft
$98/Sq Ft
Est. Value
About This Home
This home is located at 3776 E Pleasant Run Parkway North Dr, Indianapolis, IN 46201 and is currently estimated at $125,737, approximately $98 per square foot. 3776 E Pleasant Run Parkway North Dr is a home located in Marion County with nearby schools including Ralph Waldo Emerson School 58, William McKinley School 39, and Eleanor Skillen School No. 34.
Ownership History
Date
Name
Owned For
Owner Type
Purchase Details
Closed on
Dec 16, 2024
Sold by
Ale Realty Company Llc
Bought by
Pittman Dewayne L
Current Estimated Value
Purchase Details
Closed on
Sep 22, 2021
Sold by
Whitney Co Llc
Bought by
A L E Realty Co Llc
Purchase Details
Closed on
Sep 20, 2021
Sold by
Whitney Company Llc
Bought by
Ale Realty Company Llc
Purchase Details
Closed on
Jul 16, 2018
Sold by
Tom Ellis
Bought by
Jason Whitney
Purchase Details
Closed on
Jan 22, 2016
Sold by
Fountain Realty Inc
Bought by
The Whitney Company Llc
Purchase Details
Closed on
Jul 25, 2011
Sold by
Pnc Bank N A
Bought by
Fountain Realty Llc
Purchase Details
Closed on
Aug 25, 2010
Sold by
Sparks Theodore G
Bought by
Pnc Bank N A
Create a Home Valuation Report for This Property
The Home Valuation Report is an in-depth analysis detailing your home's value as well as a comparison with similar homes in the area
Home Values in the Area
Average Home Value in this Area
Purchase History
| Date | Buyer | Sale Price | Title Company |
|---|---|---|---|
| Pittman Dewayne L | -- | None Listed On Document | |
| Pittman Dewayne L | -- | None Listed On Document | |
| A L E Realty Co Llc | $55,000 | None Available | |
| Ale Realty Company Llc | -- | None Listed On Document | |
| Jason Whitney | $40,000 | -- | |
| The Whitney Company Llc | -- | None Available | |
| Fountain Realty Inc | -- | None Available | |
| Fountain Realty Llc | $25,000 | None Available | |
| Pnc Bank N A | $25,000 | None Available |
Source: Public Records
Tax History Compared to Growth
Tax History
| Year | Tax Paid | Tax Assessment Tax Assessment Total Assessment is a certain percentage of the fair market value that is determined by local assessors to be the total taxable value of land and additions on the property. | Land | Improvement |
|---|---|---|---|---|
| 2024 | $2,248 | $95,600 | $8,300 | $87,300 |
| 2023 | $2,248 | $90,300 | $8,300 | $82,000 |
| 2022 | $2,307 | $93,300 | $8,300 | $85,000 |
| 2021 | $1,783 | $72,900 | $8,300 | $64,600 |
| 2020 | $1,644 | $66,700 | $4,200 | $62,500 |
| 2019 | $1,532 | $60,800 | $4,200 | $56,600 |
| 2018 | $1,426 | $55,900 | $4,200 | $51,700 |
| 2017 | $1,171 | $50,800 | $4,200 | $46,600 |
| 2016 | $856 | $36,900 | $4,200 | $32,700 |
| 2014 | $1,007 | $51,000 | $4,200 | $46,800 |
| 2013 | $1,173 | $55,000 | $4,200 | $50,800 |
Source: Public Records
Map
Nearby Homes
- 3780 E Pleasant Run Parkway Dr N
- 219 S Sherman Dr
- 3618 Spann Ave
- 243 S Bradley Ave
- 3713 Spann Ave
- 52 S Dearborn St
- 350 S Dearborn St
- 406 S Dearborn St
- 3106 Newton Ave
- 41 S Sherman Dr
- 3114 English Ave
- 67 S Dearborn St
- 264 S Grant Ave
- 331 S Oakland Ave
- 3042 Newton Ave
- 417 S Oakland Ave
- 35 S Bradley Ave
- 3949 English Ave
- 350 S Oakland Ave
- 3614 E Washington St
- 3776 E Plsnt Rn Pw N Dr
- 3776 E Pleasant Run Parkway Dr N
- 3778 E Pleasant Run Parkway Dr N
- 3778 E Plsnt Rn Pw N Dr
- 3774 E Plsnt Rn Pw N Dr
- 347 S Gale St
- 341 S Gale St
- 3780 E Pleasant Run Parkway North Dr
- 3780 E Pleasant Run Parkway North Dr
- 3780 E Plsnt Rn Pw N Dr
- 335 S Gale St
- 3772 E Plsnt Rn Pw N Dr
- 3782 E Plsnt Rn Pw N Dr
- 261 S Gale St
- 255 S Gale St
- 3786 E Plsnt Rn Pw N Dr
- 3786 E Pleasant Run Parkway Dr N
- 324 S Gale St
- 328 S Gale St
- 320 S Gale St