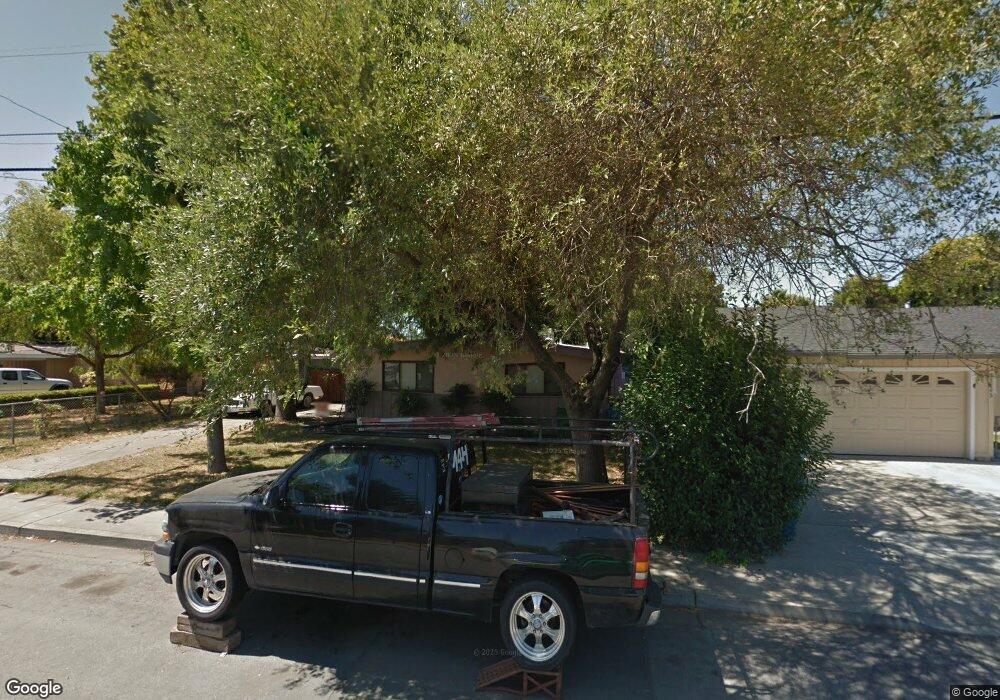
37771 Teakwood Dr Fremont, CA 94536
Glenmoor NeighborhoodEstimated Value: $788,000 - $1,479,000
3
Beds
2
Baths
1,166
Sq Ft
$1,037/Sq Ft
Est. Value
About This Home
This home is located at 37771 Teakwood Dr, Fremont, CA 94536 and is currently estimated at $1,209,342, approximately $1,037 per square foot. 37771 Teakwood Dr is a home located in Alameda County with nearby schools including Glenmoor Elementary School, Centerville Junior High School, and Washington High School.
Ownership History
Date
Name
Owned For
Owner Type
Purchase Details
Closed on
Jun 24, 2017
Sold by
Upshaw Clifford W and Liao Upshaw Huey Ru Judy
Bought by
Upshaw Clifford W and Liao Upshaw Huey Ru Judy
Current Estimated Value
Purchase Details
Closed on
Jul 29, 2003
Sold by
Upshaw Huey Ru Judy Liao and Liao Chien Ru Tracy
Bought by
Upshaw Clifford W and Upshaw Huey Ru Judy Liao
Home Financials for this Owner
Home Financials are based on the most recent Mortgage that was taken out on this home.
Original Mortgage
$199,900
Interest Rate
5.17%
Mortgage Type
Purchase Money Mortgage
Purchase Details
Closed on
Aug 4, 1998
Sold by
Douglass Mary L
Bought by
Liao Huey Ru Judy and Liao Chien Ru Tracy
Home Financials for this Owner
Home Financials are based on the most recent Mortgage that was taken out on this home.
Original Mortgage
$206,150
Interest Rate
6.93%
Create a Home Valuation Report for This Property
The Home Valuation Report is an in-depth analysis detailing your home's value as well as a comparison with similar homes in the area
Home Values in the Area
Average Home Value in this Area
Purchase History
| Date | Buyer | Sale Price | Title Company |
|---|---|---|---|
| Upshaw Clifford W | -- | None Available | |
| Upshaw Clifford W | -- | None Available | |
| Upshaw Clifford W | $67,000 | Commonwealth Land Title | |
| Liao Huey Ru Judy | $217,000 | Old Republic Title Company |
Source: Public Records
Mortgage History
| Date | Status | Borrower | Loan Amount |
|---|---|---|---|
| Closed | Upshaw Clifford W | $199,900 | |
| Closed | Liao Huey Ru Judy | $206,150 |
Source: Public Records
Tax History Compared to Growth
Tax History
| Year | Tax Paid | Tax Assessment Tax Assessment Total Assessment is a certain percentage of the fair market value that is determined by local assessors to be the total taxable value of land and additions on the property. | Land | Improvement |
|---|---|---|---|---|
| 2025 | $4,599 | $340,173 | $102,052 | $238,121 |
| 2024 | $4,599 | $333,504 | $100,051 | $233,453 |
| 2023 | $4,463 | $326,966 | $98,090 | $228,876 |
| 2022 | $4,387 | $320,556 | $96,167 | $224,389 |
| 2021 | $4,285 | $314,271 | $94,281 | $219,990 |
| 2020 | $4,235 | $311,048 | $93,314 | $217,734 |
| 2019 | $4,190 | $304,951 | $91,485 | $213,466 |
| 2018 | $4,107 | $298,973 | $89,692 | $209,281 |
| 2017 | $4,005 | $293,111 | $87,933 | $205,178 |
| 2016 | $3,928 | $287,365 | $86,209 | $201,156 |
| 2015 | $3,867 | $283,050 | $84,915 | $198,135 |
| 2014 | $3,794 | $277,505 | $83,251 | $194,254 |
Source: Public Records
Map
Nearby Homes
- 37721 Madera Ct
- 4948 Norris Rd
- 37621 Glenmoor Dr
- 4586 Norris Rd
- 37987 Alta Dr
- 37792 Colfax Ct
- 4737 Deadwood Dr
- 38324 Blacow Rd
- 5169 Lawler Ave
- 4715 Eggers Dr
- 5268 Keeler Ct
- 37114 Dondero Way
- 4754 Northdale Dr
- 37659 Granville Dr
- 4637 Rothbury Common
- 4328 Cognina Ct
- 4544 Thornton Ave
- 38265 Corrigan Ct
- 37001 Contra Costa Ave
- 4632 Balboa Way
- 37817 Teakwood Dr
- 37745 Teakwood Dr
- 37758 Madera Ct
- 37768 Madera Ct
- 37833 Teakwood Dr
- 37729 Teakwood Dr
- 37766 Teakwood Dr
- 37748 Madera Ct
- 37734 Teakwood Dr
- 4855 Los Arboles Place
- 37849 Teakwood Dr
- 37713 Teakwood Dr
- 4798 Beechwood Ave
- 4787 Beechwood Ave
- 4845 Los Arboles Place
- 37738 Madera Ct
- 4782 Dogwood Ave
- 4865 Los Arboles Place
- 37761 Madera Ct
- 4784 Beechwood Ave