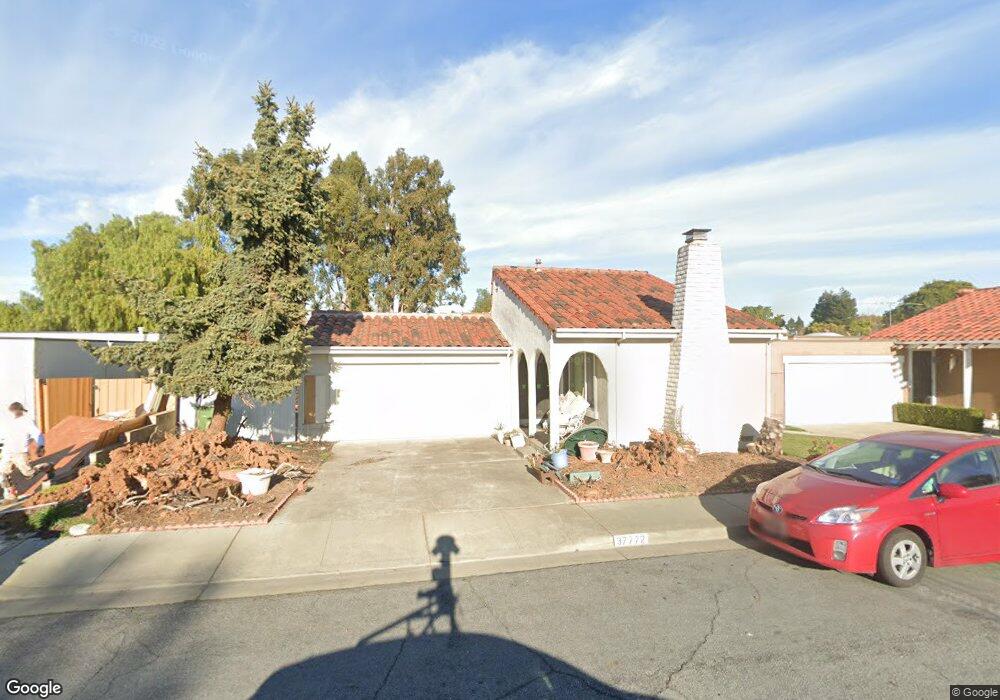
37772 Los Arboles Dr Fremont, CA 94536
Glenmoor NeighborhoodEstimated Value: $1,311,000 - $1,453,194
4
Beds
2
Baths
1,583
Sq Ft
$879/Sq Ft
Est. Value
About This Home
This home is located at 37772 Los Arboles Dr, Fremont, CA 94536 and is currently estimated at $1,391,549, approximately $879 per square foot. 37772 Los Arboles Dr is a home located in Alameda County with nearby schools including Glenmoor Elementary School, Centerville Junior High School, and Washington High School.
Ownership History
Date
Name
Owned For
Owner Type
Purchase Details
Closed on
Jun 21, 2019
Sold by
Moore Gabriel A and Feeley 2008 Trust
Bought by
Seth Ritu Bahl and Ritu Revocable Living Trust
Current Estimated Value
Home Financials for this Owner
Home Financials are based on the most recent Mortgage that was taken out on this home.
Original Mortgage
$776,720
Outstanding Balance
$681,542
Interest Rate
4%
Mortgage Type
New Conventional
Estimated Equity
$710,007
Purchase Details
Closed on
Dec 12, 2008
Sold by
Feeley Janice K
Bought by
Feeley Janice K and Feeley 2008 Trust
Purchase Details
Closed on
May 7, 1997
Sold by
Mertz Donald A and Mertz Eileen S
Bought by
Feeley Janice K
Home Financials for this Owner
Home Financials are based on the most recent Mortgage that was taken out on this home.
Original Mortgage
$155,000
Interest Rate
8.15%
Purchase Details
Closed on
Jun 27, 1995
Sold by
Mertz Donald A and Mertz Eileen S
Bought by
Mertz Donald A and Mertz Eileen S
Create a Home Valuation Report for This Property
The Home Valuation Report is an in-depth analysis detailing your home's value as well as a comparison with similar homes in the area
Home Values in the Area
Average Home Value in this Area
Purchase History
| Date | Buyer | Sale Price | Title Company |
|---|---|---|---|
| Seth Ritu Bahl | $971,000 | Fidelity National Title Co | |
| Feeley Janice K | -- | None Available | |
| Feeley Janice K | $216,000 | Old Republic Title Company | |
| Mertz Donald A | -- | -- |
Source: Public Records
Mortgage History
| Date | Status | Borrower | Loan Amount |
|---|---|---|---|
| Open | Seth Ritu Bahl | $776,720 | |
| Previous Owner | Feeley Janice K | $155,000 |
Source: Public Records
Tax History Compared to Growth
Tax History
| Year | Tax Paid | Tax Assessment Tax Assessment Total Assessment is a certain percentage of the fair market value that is determined by local assessors to be the total taxable value of land and additions on the property. | Land | Improvement |
|---|---|---|---|---|
| 2025 | $12,534 | $1,054,804 | $492,133 | $569,671 |
| 2024 | $12,534 | $1,033,988 | $482,485 | $558,503 |
| 2023 | $12,203 | $1,020,580 | $473,026 | $547,554 |
| 2022 | $12,053 | $993,570 | $463,752 | $536,818 |
| 2021 | $11,754 | $973,958 | $454,662 | $526,296 |
| 2020 | $11,814 | $970,900 | $450,000 | $520,900 |
| 2019 | $4,230 | $315,353 | $94,606 | $220,747 |
| 2018 | $4,144 | $309,171 | $92,751 | $216,420 |
| 2017 | $4,040 | $303,110 | $90,933 | $212,177 |
| 2016 | $3,961 | $297,167 | $89,150 | $208,017 |
| 2015 | $3,898 | $292,705 | $87,811 | $204,894 |
| 2014 | $3,823 | $286,972 | $86,091 | $200,881 |
Source: Public Records
Map
Nearby Homes
- 37721 Madera Ct
- 4948 Norris Rd
- 4586 Norris Rd
- 37621 Glenmoor Dr
- 37987 Alta Dr
- 37792 Colfax Ct
- 38324 Blacow Rd
- 5169 Lawler Ave
- 4715 Eggers Dr
- 4737 Deadwood Dr
- 5268 Keeler Ct
- 4754 Northdale Dr
- 37659 Granville Dr
- 37114 Dondero Way
- 4637 Rothbury Common
- 4328 Cognina Ct
- 38265 Corrigan Ct
- 4544 Thornton Ave
- 37001 Contra Costa Ave
- 4632 Balboa Way
- 37782 Los Arboles Dr
- 37762 Los Arboles Dr
- 37792 Los Arboles Dr
- 37752 Los Arboles Dr
- 4885 Los Arboles Place
- 37767 Los Arboles Dr
- 37757 Los Arboles Dr
- 37777 Los Arboles Dr
- 37742 Los Arboles Dr
- 4875 Los Arboles Place
- 37747 Los Arboles Dr
- 37787 Los Arboles Dr
- 37761 Madera Ct
- 37751 Madera Ct
- 37732 Los Arboles Dr
- 37797 Los Arboles Dr
- 4865 Los Arboles Place
- 4896 Los Arboles Place
- 4886 Los Arboles Place
- 4876 Los Arboles Place