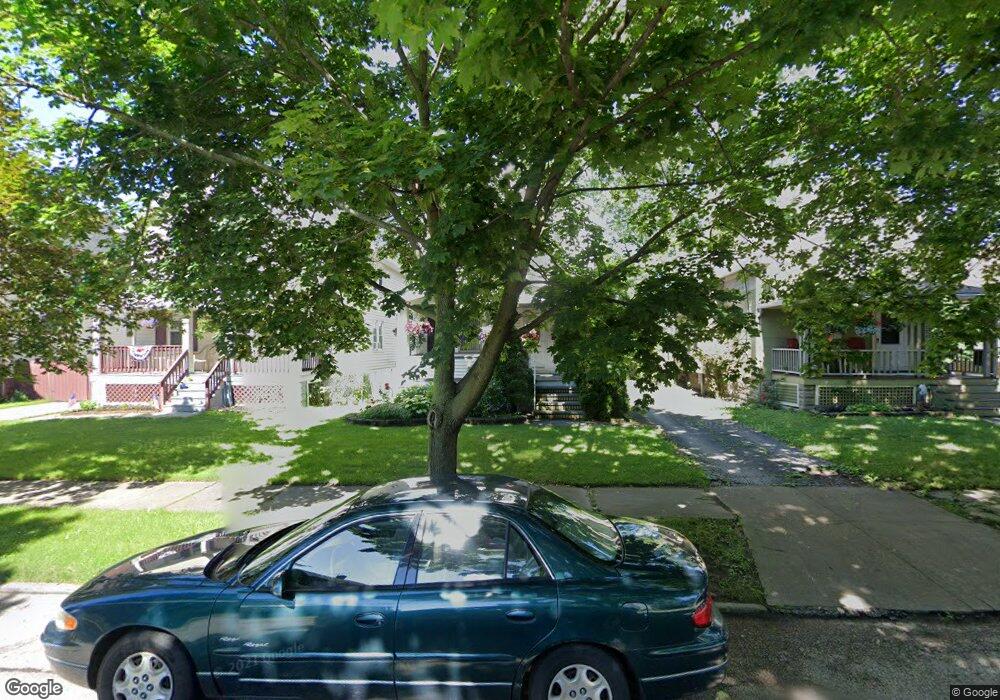
3778 W 139th St Cleveland, OH 44111
Jefferson NeighborhoodEstimated Value: $138,000 - $209,000
3
Beds
1
Bath
1,069
Sq Ft
$152/Sq Ft
Est. Value
About This Home
This home is located at 3778 W 139th St, Cleveland, OH 44111 and is currently estimated at $162,276, approximately $151 per square foot. 3778 W 139th St is a home located in Cuyahoga County with nearby schools including Artemus Ward School, Almira Academy, and Benjamin Franklin.
Ownership History
Date
Name
Owned For
Owner Type
Purchase Details
Closed on
Mar 27, 2003
Sold by
Holliday Robert L and Holliday Carole A
Bought by
Medina Candido
Current Estimated Value
Home Financials for this Owner
Home Financials are based on the most recent Mortgage that was taken out on this home.
Original Mortgage
$100,383
Outstanding Balance
$43,757
Interest Rate
5.95%
Mortgage Type
FHA
Estimated Equity
$118,519
Purchase Details
Closed on
May 18, 1998
Sold by
Johnson John P and Johnson Laura L
Bought by
Holliday Robert L and Holliday Carole A
Home Financials for this Owner
Home Financials are based on the most recent Mortgage that was taken out on this home.
Original Mortgage
$66,300
Interest Rate
7.19%
Purchase Details
Closed on
Sep 16, 1988
Sold by
Samford Crawford and Samford Renee R
Bought by
Johnson John P
Purchase Details
Closed on
Jun 29, 1987
Sold by
Bobey Richard A and V L
Bought by
Samford Crawford and Samford Renee R
Purchase Details
Closed on
Jan 1, 1975
Bought by
Bobey Richard A and Bobey L
Create a Home Valuation Report for This Property
The Home Valuation Report is an in-depth analysis detailing your home's value as well as a comparison with similar homes in the area
Home Values in the Area
Average Home Value in this Area
Purchase History
| Date | Buyer | Sale Price | Title Company |
|---|---|---|---|
| Medina Candido | $102,000 | Midland Title Security Inc | |
| Holliday Robert L | $78,000 | Title Experts Agency Inc | |
| Johnson John P | $17,000 | -- | |
| Samford Crawford | $49,900 | -- | |
| Bobey Richard A | -- | -- |
Source: Public Records
Mortgage History
| Date | Status | Borrower | Loan Amount |
|---|---|---|---|
| Open | Medina Candido | $100,383 | |
| Previous Owner | Holliday Robert L | $66,300 |
Source: Public Records
Tax History Compared to Growth
Tax History
| Year | Tax Paid | Tax Assessment Tax Assessment Total Assessment is a certain percentage of the fair market value that is determined by local assessors to be the total taxable value of land and additions on the property. | Land | Improvement |
|---|---|---|---|---|
| 2024 | $2,175 | $42,980 | $9,660 | $33,320 |
| 2023 | $1,766 | $32,450 | $7,040 | $25,410 |
| 2022 | $1,787 | $32,450 | $7,040 | $25,410 |
| 2021 | $1,769 | $32,450 | $7,040 | $25,410 |
| 2020 | $1,418 | $25,170 | $5,460 | $19,710 |
| 2019 | $1,311 | $71,900 | $15,600 | $56,300 |
| 2018 | $1,356 | $25,170 | $5,460 | $19,710 |
| 2017 | $1,418 | $25,940 | $4,270 | $21,670 |
| 2016 | $1,407 | $25,940 | $4,270 | $21,670 |
| 2015 | $1,523 | $25,940 | $4,270 | $21,670 |
| 2014 | $1,523 | $27,300 | $4,480 | $22,820 |
Source: Public Records
Map
Nearby Homes
- 13910 Lyric Ave
- 14014 Parkdale Ave
- 14018 Parkdale Ave
- 3725 W 137th St
- 3774 W 135th St
- 3728 W 136th St
- 3645 W 139th St
- 14128 Lakota Ave
- 3642 W 139th St
- 3811 W 135th St
- 13921 Wainstead Ave
- 13716 Tyler Ave
- 3878 W 134th St
- 14114 Berwyn Ave
- 13514 Tyler Ave
- 13818 Courtland Ave
- 14319 Fairlawn Ave
- 13931 Lorain Ave
- 3842 W 133rd St
- 13328 West Ave
- 3774 W 139th St
- 3784 W 139th St
- 3770 W 139th St
- 3788 W 139th St
- 13926 Sacramento Ave
- 3766 W 139th St
- 13942 Sacramento Ave
- 3790 W 139th St
- 3797 W 140th St
- 3791 W 140th St
- 3762 W 139th St
- 3787 W 140th St
- 3799 W 140th St
- 3787 W 139th St
- 3795 W 140th St Unit Up
- 3807 W 140th St
- 3777 W 139th St
- 3791 W 139th St
- 3775 W 139th St
- 3758 W 139th St