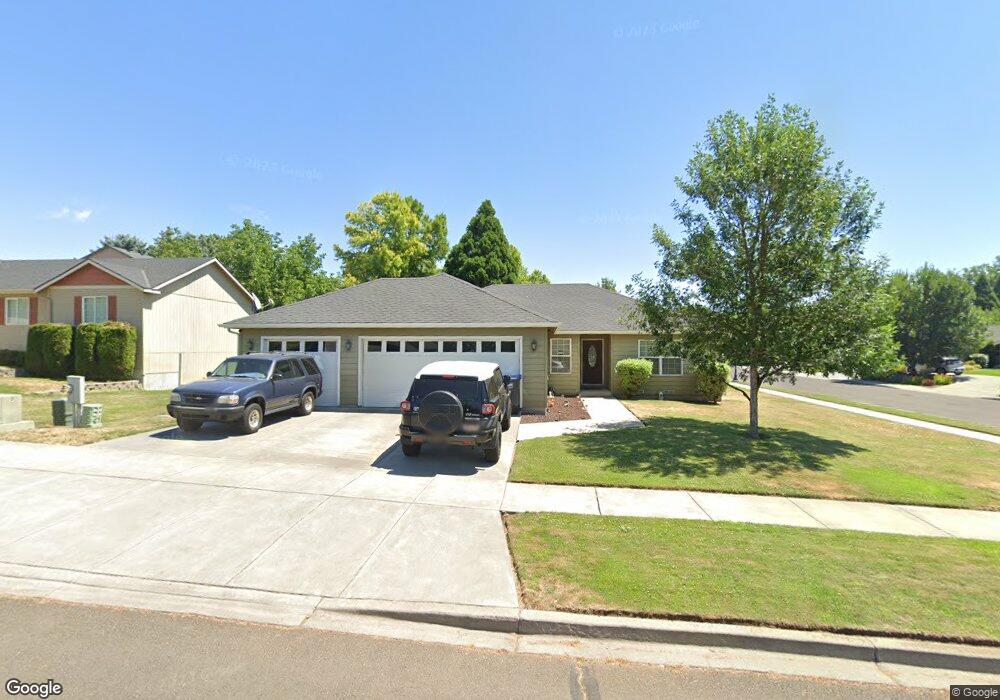
378 Austin St Walla Walla, WA 99362
Estimated Value: $463,000 - $563,000
3
Beds
2
Baths
1,646
Sq Ft
$313/Sq Ft
Est. Value
About This Home
This home is located at 378 Austin St, Walla Walla, WA 99362 and is currently estimated at $514,860, approximately $312 per square foot. 378 Austin St is a home located in Walla Walla County with nearby schools including Prospect Point Elementary School, Garrison Middle School, and Willow Public School.
Ownership History
Date
Name
Owned For
Owner Type
Purchase Details
Closed on
May 4, 2011
Sold by
Whatley Barbara J
Bought by
Parris Jack R
Current Estimated Value
Home Financials for this Owner
Home Financials are based on the most recent Mortgage that was taken out on this home.
Original Mortgage
$225,710
Outstanding Balance
$156,569
Interest Rate
4.84%
Mortgage Type
VA
Estimated Equity
$358,291
Purchase Details
Closed on
Feb 27, 2009
Sold by
Majerus Construction Inc
Bought by
Whatley Barbara J
Purchase Details
Closed on
Feb 7, 2008
Sold by
Majerus Douglas A and Majerus Christina M
Bought by
Majerus Construction Inc
Home Financials for this Owner
Home Financials are based on the most recent Mortgage that was taken out on this home.
Original Mortgage
$643,200
Interest Rate
6.17%
Mortgage Type
Construction
Create a Home Valuation Report for This Property
The Home Valuation Report is an in-depth analysis detailing your home's value as well as a comparison with similar homes in the area
Home Values in the Area
Average Home Value in this Area
Purchase History
| Date | Buyer | Sale Price | Title Company |
|---|---|---|---|
| Parris Jack R | $218,500 | Land Title Of Walla Walla Co | |
| Whatley Barbara J | $160,000 | Walla Walla Title Company | |
| Majerus Construction Inc | -- | Land Title Walla Walla Count |
Source: Public Records
Mortgage History
| Date | Status | Borrower | Loan Amount |
|---|---|---|---|
| Open | Parris Jack R | $225,710 | |
| Previous Owner | Majerus Construction Inc | $643,200 |
Source: Public Records
Tax History Compared to Growth
Tax History
| Year | Tax Paid | Tax Assessment Tax Assessment Total Assessment is a certain percentage of the fair market value that is determined by local assessors to be the total taxable value of land and additions on the property. | Land | Improvement |
|---|---|---|---|---|
| 2024 | $3,830 | $435,380 | $100,000 | $335,380 |
| 2023 | $3,830 | $435,380 | $100,000 | $335,380 |
| 2022 | $3,767 | $389,890 | $85,000 | $304,890 |
| 2021 | $3,178 | $350,120 | $85,000 | $265,120 |
| 2020 | $3,153 | $267,840 | $85,000 | $182,840 |
| 2019 | $2,687 | $267,840 | $85,000 | $182,840 |
| 2018 | $3,284 | $249,710 | $50,000 | $199,710 |
| 2017 | $2,725 | $249,710 | $50,000 | $199,710 |
| 2016 | $2,864 | $223,660 | $50,000 | $173,660 |
| 2015 | $2,747 | $223,660 | $50,000 | $173,660 |
| 2014 | -- | $218,600 | $50,000 | $168,600 |
| 2013 | -- | $218,600 | $50,000 | $168,600 |
Source: Public Records
Map
Nearby Homes
- 435 Whistling Duck Rd
- 409 Whistling Duck Rd
- 185 Buttonquail Ln
- 605 Kingbird Ct
- 609 Kingbird Ct
- 613 Kingbird Ct
- 617 Kingbird Ct
- 631 Kingbird Ct
- 47 Austin St
- 101 Costello Place
- 285 Arabica Rd
- 342 Roxy Ln
- 120 Costello Place
- 2552 Cottonwood Rd
- 2499 Cottonwood Rd
- 293 Arabica Rd
- 2520 Sandalwood Ct
- 0 Kendall Rd
- 125 Ponderosa Ct
- 2150 Paramount St
- 390 Austin St
- 35 Button Quail Ln
- 35 Buttonquail Ln
- 8 Button Quail Ln
- 379 Austin St
- 24 Buttonquail Ln
- 391 Austin St
- 360 Austin St
- 55 Buttonquail Ln
- 353 Austin St
- 55 Button Quail Ln
- 42 Buttonquail Ln
- 42 Button Quail Ln
- 310 Whistling Duck Rd
- 342 Austin St
- 216 Whistling Duck Rd
- 267 Whistling Duck Rd
- 255 Whistling Duck Rd
- 40 Falcon Ct
- 42 Falcon Ct