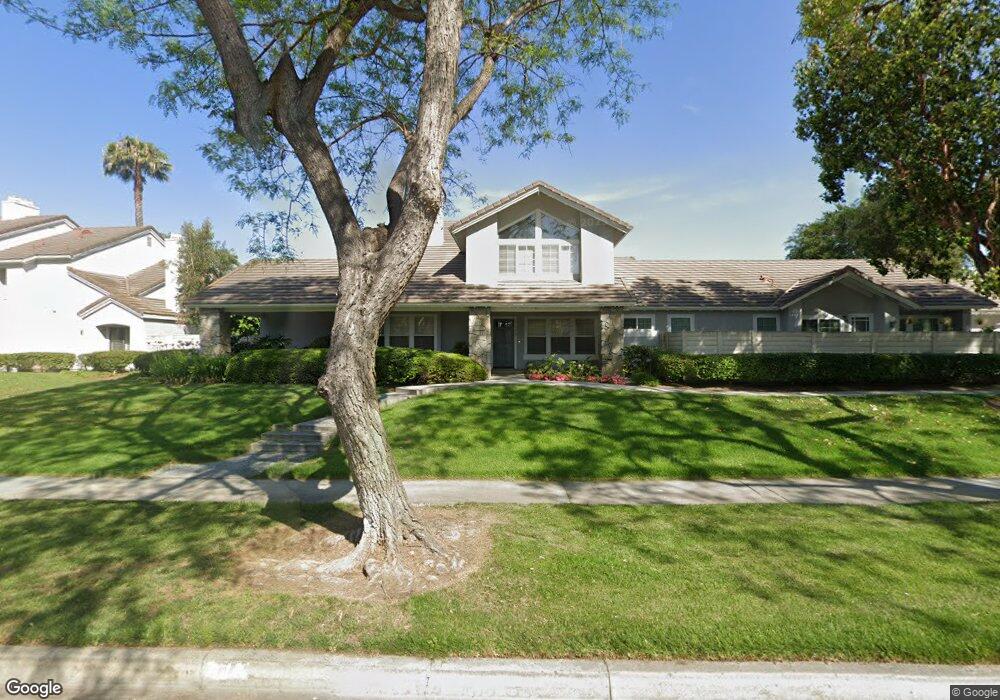
378 E Yale Loop Unit 6 Irvine, CA 92614
Woodbridge NeighborhoodEstimated Value: $1,394,000 - $1,552,965
4
Beds
3
Baths
2,325
Sq Ft
$632/Sq Ft
Est. Value
About This Home
This home is located at 378 E Yale Loop Unit 6, Irvine, CA 92614 and is currently estimated at $1,469,241, approximately $631 per square foot. 378 E Yale Loop Unit 6 is a home located in Orange County with nearby schools including Springbrook Elementary School, South Lake Middle School, and Woodbridge High School.
Ownership History
Date
Name
Owned For
Owner Type
Purchase Details
Closed on
Sep 17, 2024
Sold by
Barker Donna M
Bought by
Donna Barker Living Trust and Campbell
Current Estimated Value
Purchase Details
Closed on
Feb 11, 2002
Sold by
Gonca Demir and Gonca Nazan E
Bought by
Barker James F and Barker Donna M
Home Financials for this Owner
Home Financials are based on the most recent Mortgage that was taken out on this home.
Original Mortgage
$326,000
Interest Rate
6.99%
Create a Home Valuation Report for This Property
The Home Valuation Report is an in-depth analysis detailing your home's value as well as a comparison with similar homes in the area
Home Values in the Area
Average Home Value in this Area
Purchase History
| Date | Buyer | Sale Price | Title Company |
|---|---|---|---|
| Donna Barker Living Trust | -- | None Listed On Document | |
| Barker James F | $407,500 | Fidelity National Title Ins |
Source: Public Records
Mortgage History
| Date | Status | Borrower | Loan Amount |
|---|---|---|---|
| Previous Owner | Barker James F | $326,000 | |
| Closed | Barker James F | $40,750 |
Source: Public Records
Tax History
| Year | Tax Paid | Tax Assessment Tax Assessment Total Assessment is a certain percentage of the fair market value that is determined by local assessors to be the total taxable value of land and additions on the property. | Land | Improvement |
|---|---|---|---|---|
| 2025 | $6,302 | $601,990 | $296,154 | $305,836 |
| 2024 | $6,302 | $590,187 | $290,347 | $299,840 |
| 2023 | $6,138 | $578,615 | $284,654 | $293,961 |
| 2022 | $6,019 | $567,270 | $279,072 | $288,198 |
| 2021 | $5,879 | $556,148 | $273,600 | $282,548 |
| 2020 | $5,846 | $550,446 | $270,795 | $279,651 |
| 2019 | $5,715 | $539,653 | $265,485 | $274,168 |
| 2018 | $5,613 | $529,072 | $260,279 | $268,793 |
| 2017 | $5,497 | $518,699 | $255,176 | $263,523 |
| 2016 | $5,254 | $508,529 | $250,173 | $258,356 |
| 2015 | $5,175 | $500,891 | $246,415 | $254,476 |
| 2014 | $5,075 | $491,080 | $241,588 | $249,492 |
Source: Public Records
Map
Nearby Homes
- 376 E Yale Loop
- 374 E Yale Loop
- 380 E Yale Loop Unit 5
- 380 E Yale Loop
- 382 E Yale Loop Unit 4
- 382 E Yale Loop
- 36 Silkberry
- 34 Silkberry
- 38 Silkberry
- 32 Silkberry
- 40 Silkberry
- 30 Silkberry
- 384 E Yale Loop Unit 3
- 42 Silkberry
- 370 E Yale Loop Unit 10
- 370 E Yale Loop
- 386 E Yale Loop Unit 2
- 386 E Yale Loop
- 28 Silkberry
- 44 Silkberry
Your Personal Tour Guide
Ask me questions while you tour the home.