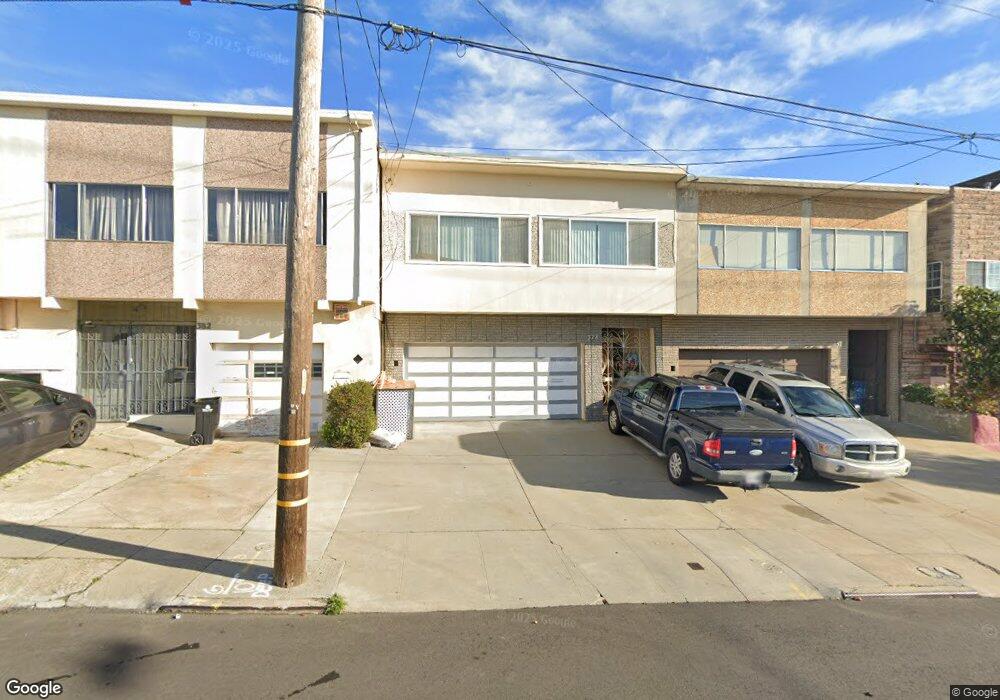
378 Leland Ave San Francisco, CA 94134
Visitacion Valley NeighborhoodEstimated Value: $1,031,000 - $1,256,000
4
Beds
3
Baths
1,910
Sq Ft
$604/Sq Ft
Est. Value
About This Home
This home is located at 378 Leland Ave, San Francisco, CA 94134 and is currently estimated at $1,152,941, approximately $603 per square foot. 378 Leland Ave is a home located in San Francisco County with nearby schools including El Dorado Elementary School, Visitacion Valley Middle School, and KIPP Bayview Academy.
Ownership History
Date
Name
Owned For
Owner Type
Purchase Details
Closed on
Nov 12, 2021
Sold by
Palega Vaasa
Bought by
Palega Vaasa and 2021 Vaasa Palega Revocable Tr
Current Estimated Value
Purchase Details
Closed on
Mar 16, 2006
Sold by
Palega Vaasa F
Bought by
Palega Vaasa F
Home Financials for this Owner
Home Financials are based on the most recent Mortgage that was taken out on this home.
Original Mortgage
$240,000
Interest Rate
6.18%
Mortgage Type
New Conventional
Create a Home Valuation Report for This Property
The Home Valuation Report is an in-depth analysis detailing your home's value as well as a comparison with similar homes in the area
Home Values in the Area
Average Home Value in this Area
Purchase History
| Date | Buyer | Sale Price | Title Company |
|---|---|---|---|
| Palega Vaasa | -- | None Available | |
| Palega Vaasa F | -- | Chicago Title Co |
Source: Public Records
Mortgage History
| Date | Status | Borrower | Loan Amount |
|---|---|---|---|
| Closed | Palega Vaasa F | $240,000 |
Source: Public Records
Tax History Compared to Growth
Tax History
| Year | Tax Paid | Tax Assessment Tax Assessment Total Assessment is a certain percentage of the fair market value that is determined by local assessors to be the total taxable value of land and additions on the property. | Land | Improvement |
|---|---|---|---|---|
| 2025 | $1,249 | $106,211 | $22,373 | $83,838 |
| 2024 | $1,249 | $104,130 | $21,935 | $82,195 |
| 2023 | $1,231 | $102,089 | $21,505 | $80,584 |
| 2022 | $1,209 | $100,088 | $21,084 | $79,004 |
| 2021 | $1,189 | $98,126 | $20,671 | $77,455 |
| 2020 | $1,191 | $97,121 | $20,460 | $76,661 |
| 2019 | $1,152 | $95,217 | $20,059 | $75,158 |
| 2018 | $1,115 | $93,351 | $19,666 | $73,685 |
| 2017 | $1,102 | $91,522 | $19,281 | $72,241 |
| 2016 | $1,055 | $89,728 | $18,903 | $70,825 |
| 2015 | $1,041 | $88,382 | $18,620 | $69,762 |
| 2014 | $1,014 | $86,652 | $18,256 | $68,396 |
Source: Public Records
Map
Nearby Homes
- 291 Raymond Ave
- 550 Leland Ave
- 771 Delta St
- 137 Arleta Ave
- 73 Tioga Ave
- 1316 Bowdoin St
- 420 Harkness Ave
- 750 Mansell St
- 0 Accacia St
- 1162 Bowdoin St
- 1081 Goettingen St
- 248 Ordway St
- 3630 San Bruno Ave
- 68 Esquina Dr
- 311 Ottilia St
- 819 Brussels St
- 1801 Geneva Ave
- 1383 Bacon St
- 38 Jennings Ct Unit 38
- 107 Dwight St