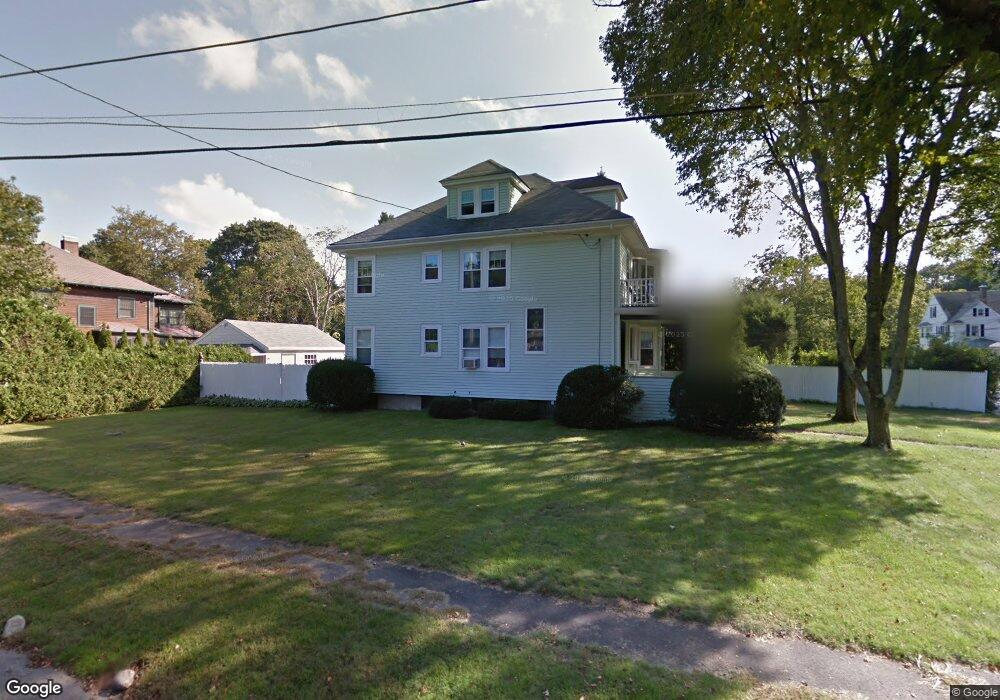
378 Manning St Needham, MA 02492
Estimated Value: $1,253,000 - $1,543,000
4
Beds
2
Baths
1,207
Sq Ft
$1,176/Sq Ft
Est. Value
About This Home
This home is located at 378 Manning St, Needham, MA 02492 and is currently estimated at $1,419,753, approximately $1,176 per square foot. 378 Manning St is a home located in Norfolk County with nearby schools including Mitchell Elementary School, High Rock Middle School, and Pollard Middle School.
Ownership History
Date
Name
Owned For
Owner Type
Purchase Details
Closed on
Jul 30, 2015
Sold by
Kohlback Clinton J and Kohlback Susan
Bought by
Kohlback Ft and Kohlback
Current Estimated Value
Purchase Details
Closed on
Jul 25, 1973
Bought by
Kohlback Clinton J
Create a Home Valuation Report for This Property
The Home Valuation Report is an in-depth analysis detailing your home's value as well as a comparison with similar homes in the area
Home Values in the Area
Average Home Value in this Area
Purchase History
| Date | Buyer | Sale Price | Title Company |
|---|---|---|---|
| Kohlback Ft | -- | -- | |
| Kohlback Ft | -- | -- | |
| Kohlback Clinton J | $47,900 | -- |
Source: Public Records
Mortgage History
| Date | Status | Borrower | Loan Amount |
|---|---|---|---|
| Previous Owner | Kohlback Clinton J | $100,000 |
Source: Public Records
Tax History
| Year | Tax Paid | Tax Assessment Tax Assessment Total Assessment is a certain percentage of the fair market value that is determined by local assessors to be the total taxable value of land and additions on the property. | Land | Improvement |
|---|---|---|---|---|
| 2025 | $10,758 | $1,014,900 | $800,700 | $214,200 |
| 2024 | $9,977 | $796,900 | $581,500 | $215,400 |
| 2023 | $10,179 | $780,600 | $581,500 | $199,100 |
| 2022 | $9,759 | $729,900 | $538,500 | $191,400 |
| 2021 | $9,511 | $729,900 | $538,500 | $191,400 |
| 2020 | $9,361 | $749,500 | $538,500 | $211,000 |
| 2019 | $8,654 | $698,500 | $489,600 | $208,900 |
| 2018 | $8,298 | $698,500 | $489,600 | $208,900 |
| 2017 | $7,984 | $671,500 | $489,600 | $181,900 |
| 2016 | $7,784 | $674,500 | $489,600 | $184,900 |
| 2015 | $7,615 | $674,500 | $489,600 | $184,900 |
| 2014 | $6,991 | $600,600 | $425,800 | $174,800 |
Source: Public Records
Map
Nearby Homes
- 36 Otis St Unit 36
- 674 Webster St
- 100 Bradford St
- 638 Webster St
- 638 Webster St Unit 638
- 34 Lincoln St Unit 34
- 19 Oakland Ave Unit 19
- 19 Highland Ct Unit 19
- 11 Holmes St
- 68 Pleasant St Unit 68
- 971 Webster St
- 126 Prince St
- 193 Garden St
- 190 Brookline St
- 1011 Webster St
- 31 Birds Hill Ave
- 1034 Webster St
- 60 Sutton Rd
- 78 Birds Hill Ave
- 176 Highgate St
- 384 Manning St
- 40 Otis St Unit L
- 26 Otis St
- 35 Otis St
- 42 Otis St Unit R
- 388 Manning St Unit 2
- 388 Manning St Unit 1
- 25 Otis St
- 20 Otis St
- 377 Manning St
- 394 Manning St
- 383 Manning St
- 389 Manning St
- 362 Manning St
- 21 Otis St
- 369 Manning St
- 727 Great Plain Ave
- 14 Otis St
- 739 Great Plain Ave
- 361 Manning St
Your Personal Tour Guide
Ask me questions while you tour the home.