Estimated Value: $255,359 - $292,000
4
Beds
3
Baths
2,432
Sq Ft
$112/Sq Ft
Est. Value
About This Home
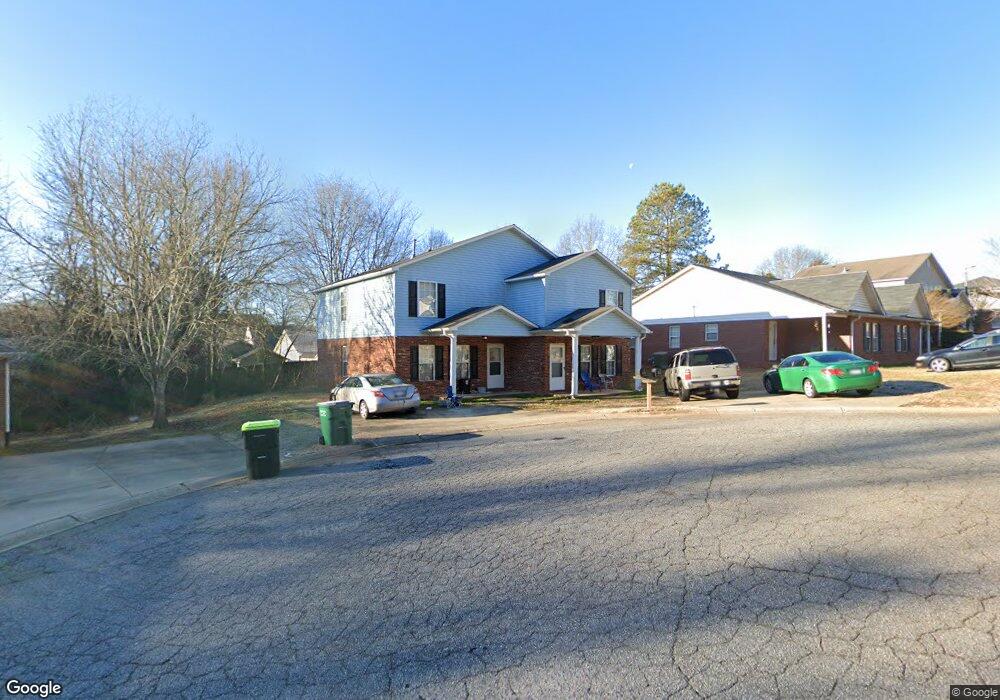
This home is located at 378 Miller Pointe Dr Unit 380, Inman, SC 29349 and is currently estimated at $272,090, approximately $111 per square foot. 378 Miller Pointe Dr Unit 380 is a home located in Spartanburg County with nearby schools including Inman Elementary School, T.E. Mabry Middle School, and Chapman High School.
Ownership History
Date
Name
Owned For
Owner Type
Purchase Details
Closed on
Jul 25, 2016
Sold by
A & T Investors Llc
Bought by
Grant Phillip F
Current Estimated Value
Purchase Details
Closed on
May 20, 2005
Sold by
Ribken Antje and Ribken Thomas
Bought by
A & T Investors Llc
Purchase Details
Closed on
Feb 18, 2005
Sold by
Miller E Kent
Bought by
Ribken Thomas
Create a Home Valuation Report for This Property
The Home Valuation Report is an in-depth analysis detailing your home's value as well as a comparison with similar homes in the area
Home Values in the Area
Average Home Value in this Area
Purchase History
| Date | Buyer | Sale Price | Title Company |
|---|---|---|---|
| Grant Phillip F | $103,500 | Attorney | |
| A & T Investors Llc | -- | -- | |
| Ribken Thomas | $109,000 | -- |
Source: Public Records
Tax History Compared to Growth
Tax History
| Year | Tax Paid | Tax Assessment Tax Assessment Total Assessment is a certain percentage of the fair market value that is determined by local assessors to be the total taxable value of land and additions on the property. | Land | Improvement |
|---|---|---|---|---|
| 2025 | $3,198 | $7,873 | $950 | $6,923 |
| 2024 | $3,198 | $7,873 | $950 | $6,923 |
| 2023 | $3,198 | $7,873 | $950 | $6,923 |
| 2022 | $2,963 | $6,846 | $450 | $6,396 |
| 2021 | $3,000 | $6,936 | $450 | $6,486 |
| 2020 | $2,972 | $6,936 | $450 | $6,486 |
| 2019 | $2,972 | $6,936 | $450 | $6,486 |
| 2018 | $2,972 | $6,936 | $450 | $6,486 |
| 2017 | $2,667 | $6,210 | $450 | $5,760 |
| 2016 | $2,581 | $6,000 | $450 | $5,550 |
| 2015 | $2,550 | $6,000 | $450 | $5,550 |
| 2014 | $2,540 | $6,000 | $450 | $5,550 |
Source: Public Records
Map
Nearby Homes
- 388-390 Miller Point Dr
- 224 W Clark Rd
- 603 Ezra Ct
- 83 Blackstock Rd
- 72 Blackstock Rd
- 9041 Asheville Hwy
- 834 John Weaver Trace
- 1091 Park Rd
- 5 Vehorn St
- 101 Vega St
- 4 Cross St
- 203 Vega St
- 361 Split Oak Ln
- 41 Gosnell Ave
- 28 Blackstock Rd
- 4156 New Cut Rd
- 203 Minnie Crain Dr
- 103 Everest Dr
- 1 Dallas St
- 105 Everest Dr
- 380 Miller Pointe Dr
- 378-380 Miller Point Dr
- 368 Miller Pointe Dr Unit 370
- 388 Miller Pointe Dr
- 455 Clark Glen Dr
- 388 Miller Pointe Dr Unit 390
- 449 Clark Glen Dr
- 358 Miller Pointe Dr
- 443 Clark Glen Dr
- 461 Clark Glen Dr
- 387 Miller Pointe Dr Unit 389
- 437 Clark Glen Dr
- 377 Miller Pointe Dr Unit 379
- 367 Miller Pointe Dr Unit 369
- 431 Clark Glen Dr
- 348 Miller Pointe Dr
- 359 Miller Pointe Dr Unit 361
- 350 Miller Pointe Dr
- 425 Clark Glen Dr
- 349 Miller Pointe Dr Unit 351