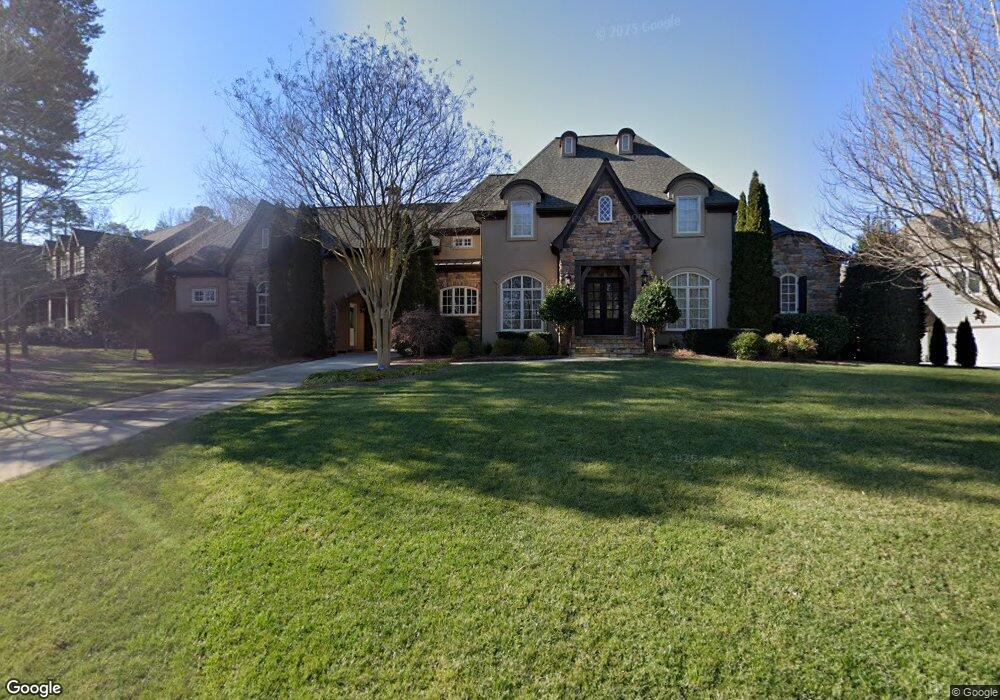
378 Montmorenci Crossing Fort Mill, SC 29715
Springfield NeighborhoodEstimated Value: $1,744,600 - $1,888,000
5
Beds
8
Baths
5,824
Sq Ft
$309/Sq Ft
Est. Value
About This Home
This home is located at 378 Montmorenci Crossing, Fort Mill, SC 29715 and is currently estimated at $1,800,200, approximately $309 per square foot. 378 Montmorenci Crossing is a home located in York County with nearby schools including Fort Mill Elementary School, Fort Mill Middle School, and Nation Ford High School.
Ownership History
Date
Name
Owned For
Owner Type
Purchase Details
Closed on
Aug 4, 2010
Sold by
Dobbins James A and Dobbins Patricia W
Bought by
Dobbins James A and Dobbins Patricia W
Current Estimated Value
Purchase Details
Closed on
Mar 25, 2010
Sold by
Peoples Bank
Bought by
Dobbins James A and Dobbins Patricia W
Home Financials for this Owner
Home Financials are based on the most recent Mortgage that was taken out on this home.
Original Mortgage
$285,000
Outstanding Balance
$232,567
Interest Rate
4.97%
Mortgage Type
Credit Line Revolving
Estimated Equity
$1,567,633
Purchase Details
Closed on
Oct 21, 2009
Sold by
Lifestyle Custom Homes Inc
Bought by
Peoples Bank
Purchase Details
Closed on
Nov 30, 2006
Sold by
Springfield Crescent Llc
Bought by
Lifestyle Custom Homes Inc
Home Financials for this Owner
Home Financials are based on the most recent Mortgage that was taken out on this home.
Original Mortgage
$115,200
Interest Rate
6.31%
Mortgage Type
Construction
Create a Home Valuation Report for This Property
The Home Valuation Report is an in-depth analysis detailing your home's value as well as a comparison with similar homes in the area
Home Values in the Area
Average Home Value in this Area
Purchase History
| Date | Buyer | Sale Price | Title Company |
|---|---|---|---|
| Dobbins James A | -- | -- | |
| Dobbins James A | $877,500 | -- | |
| Peoples Bank | -- | -- | |
| Lifestyle Custom Homes Inc | $128,000 | None Available |
Source: Public Records
Mortgage History
| Date | Status | Borrower | Loan Amount |
|---|---|---|---|
| Open | Dobbins James A | $285,000 | |
| Closed | Dobbins James A | $417,000 | |
| Previous Owner | Lifestyle Custom Homes Inc | $115,200 |
Source: Public Records
Tax History Compared to Growth
Tax History
| Year | Tax Paid | Tax Assessment Tax Assessment Total Assessment is a certain percentage of the fair market value that is determined by local assessors to be the total taxable value of land and additions on the property. | Land | Improvement |
|---|---|---|---|---|
| 2024 | $8,074 | $33,396 | $6,103 | $27,293 |
| 2023 | $7,893 | $33,396 | $6,106 | $27,290 |
| 2022 | $7,660 | $33,396 | $6,106 | $27,290 |
| 2021 | -- | $33,396 | $6,106 | $27,290 |
| 2020 | $7,977 | $33,396 | $0 | $0 |
| 2019 | $8,043 | $29,040 | $0 | $0 |
| 2018 | $8,412 | $29,040 | $0 | $0 |
| 2017 | $8,081 | $29,040 | $0 | $0 |
| 2016 | $8,052 | $29,040 | $0 | $0 |
| 2014 | $6,626 | $29,040 | $5,800 | $23,240 |
| 2013 | $6,626 | $30,880 | $5,000 | $25,880 |
Source: Public Records
Map
Nearby Homes
- 253 Buckner Hill Ln
- 126 Gragg House Rd
- 945 Vogel Way
- 1266 Lange Ct
- 1290 Lange Ct
- 524 Becker Ave
- 5475 Spruce St Unit 256
- 5471 Spruce St Unit 257
- 7216 Meyer Rd
- 5455 Spruce St Unit 260
- 5455 Spruce St
- 238 Cherrytree Dr
- 1112 Wagner Ave
- 918 Kirby Dr
- 4334 Durango Dr Unit 265
- 4334 Durango Dr
- 3128 Beacon Heights Rd
- 3155 Beacon Heights Rd
- 3159 Beacon Heights Rd
- 3157 Beacon Heights Rd
- 378 Montmorenci Crossing Unit , 135
- 382 Montmorenci Crossing
- 372 Montmorenci Crossing
- 386 Montmorenci Crossing
- 406 Belo Ct
- 366 Montmorenci Crossing
- 381 Montmorenci Crossing
- 385 Montmorenci Crossing
- 360 Montmorenci Crossing
- 360 Montmorenci Crossing Unit 138
- 405 Belo Ct
- 391 Montmorenci Crossing
- 405 Belo Ct
- 412 Belo Ct Unit 120
- 506 Cooleewee Ct
- 688 Bannerman Ln
- 688 Bannerman Ln Unit 225
- 692 Bannerman Ln
- 684 Bannerman Ln Unit 224
- 684 Bannerman Ln