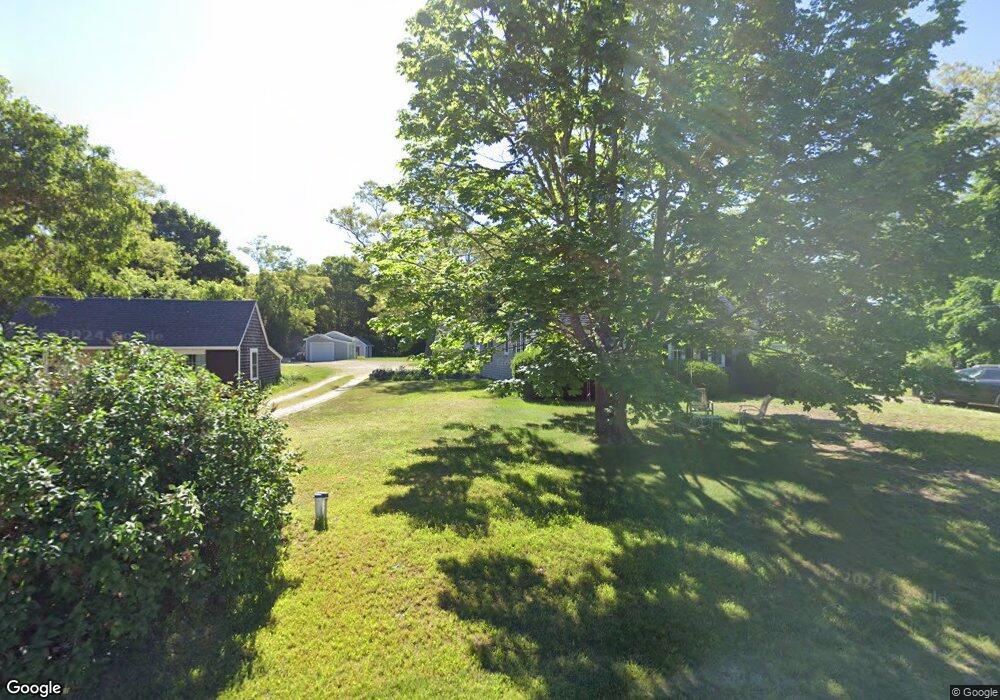
378 Plum St West Barnstable, MA 02668
West Barnstable NeighborhoodEstimated Value: $609,000 - $738,000
4
Beds
2
Baths
1,418
Sq Ft
$465/Sq Ft
Est. Value
About This Home
This home is located at 378 Plum St, West Barnstable, MA 02668 and is currently estimated at $658,950, approximately $464 per square foot. 378 Plum St is a home located in Barnstable County with nearby schools including West Barnstable Elementary School, Barnstable United Elementary School, and Barnstable Intermediate School.
Ownership History
Date
Name
Owned For
Owner Type
Purchase Details
Closed on
Mar 18, 2020
Sold by
Johnson Timothy P
Bought by
Johnson Timothy P and Macdonald Jeanne
Current Estimated Value
Home Financials for this Owner
Home Financials are based on the most recent Mortgage that was taken out on this home.
Original Mortgage
$368,000
Outstanding Balance
$321,003
Interest Rate
3.4%
Mortgage Type
New Conventional
Estimated Equity
$337,947
Purchase Details
Closed on
May 2, 2016
Sold by
Johnson Peter and Wirtanen Karen
Bought by
Johnson Timothy
Home Financials for this Owner
Home Financials are based on the most recent Mortgage that was taken out on this home.
Original Mortgage
$269,500
Interest Rate
3%
Mortgage Type
New Conventional
Purchase Details
Closed on
Apr 3, 2009
Sold by
Johnson Edward
Bought by
Wirtanen Karen and Johnson Peter E
Create a Home Valuation Report for This Property
The Home Valuation Report is an in-depth analysis detailing your home's value as well as a comparison with similar homes in the area
Home Values in the Area
Average Home Value in this Area
Purchase History
| Date | Buyer | Sale Price | Title Company |
|---|---|---|---|
| Johnson Timothy P | -- | None Available | |
| Johnson Timothy P | $337,000 | -- | |
| Wirtanen Karen | -- | -- | |
| Wirtanen Karen | -- | -- |
Source: Public Records
Mortgage History
| Date | Status | Borrower | Loan Amount |
|---|---|---|---|
| Open | Johnson Timothy P | $368,000 | |
| Previous Owner | Johnson Timothy P | $269,500 |
Source: Public Records
Tax History
| Year | Tax Paid | Tax Assessment Tax Assessment Total Assessment is a certain percentage of the fair market value that is determined by local assessors to be the total taxable value of land and additions on the property. | Land | Improvement |
|---|---|---|---|---|
| 2025 | $5,899 | $631,600 | $283,400 | $348,200 |
| 2024 | $5,238 | $610,500 | $283,400 | $327,100 |
| 2023 | $5,244 | $575,600 | $280,400 | $295,200 |
| 2022 | $4,767 | $429,100 | $179,600 | $249,500 |
| 2021 | $1,403 | $408,000 | $190,900 | $217,100 |
| 2020 | $1,350 | $354,400 | $202,100 | $152,300 |
| 2019 | $1,343 | $350,600 | $213,300 | $137,300 |
| 2018 | $1,214 | $332,400 | $212,700 | $119,700 |
| 2017 | $4,073 | $332,800 | $218,600 | $114,200 |
| 2016 | $3,936 | $328,300 | $214,100 | $114,200 |
| 2015 | $4,089 | $341,900 | $216,600 | $125,300 |
Source: Public Records
Map
Nearby Homes
Your Personal Tour Guide
Ask me questions while you tour the home.