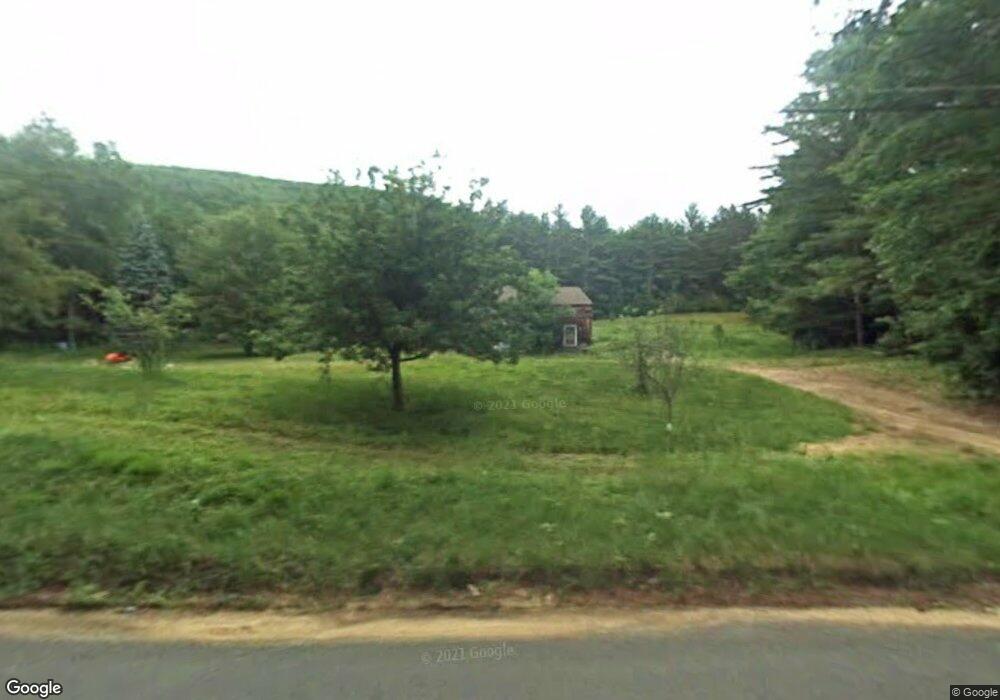
378 Tully Rd Orange, MA 01364
Estimated Value: $347,000 - $522,000
3
Beds
1
Bath
1,790
Sq Ft
$261/Sq Ft
Est. Value
About This Home
This home is located at 378 Tully Rd, Orange, MA 01364 and is currently estimated at $468,004, approximately $261 per square foot. 378 Tully Rd is a home located in Franklin County with nearby schools including Fisher Hill and Ralph C Mahar Regional School.
Ownership History
Date
Name
Owned For
Owner Type
Purchase Details
Closed on
Jan 15, 2026
Sold by
Fiske William C
Bought by
Harris Philip J and Harris Eric S
Current Estimated Value
Purchase Details
Closed on
Oct 15, 2002
Sold by
Beach Charles E and Beach Pamela J
Bought by
Fugere Katherine
Create a Home Valuation Report for This Property
The Home Valuation Report is an in-depth analysis detailing your home's value as well as a comparison with similar homes in the area
Home Values in the Area
Average Home Value in this Area
Purchase History
| Date | Buyer | Sale Price | Title Company |
|---|---|---|---|
| Harris Philip J | $75,500 | -- | |
| Fugere Katherine | $130,000 | -- |
Source: Public Records
Mortgage History
| Date | Status | Borrower | Loan Amount |
|---|---|---|---|
| Previous Owner | Fugere Katherine | $25,000 | |
| Previous Owner | Fugere Katherine | $45,000 | |
| Previous Owner | Fugere Katherine | $14,000 |
Source: Public Records
Tax History
| Year | Tax Paid | Tax Assessment Tax Assessment Total Assessment is a certain percentage of the fair market value that is determined by local assessors to be the total taxable value of land and additions on the property. | Land | Improvement |
|---|---|---|---|---|
| 2025 | $8,748 | $531,800 | $39,300 | $492,500 |
| 2024 | $8,356 | $479,100 | $39,300 | $439,800 |
| 2023 | $7,141 | $397,600 | $39,300 | $358,300 |
| 2022 | $6,772 | $354,200 | $39,300 | $314,900 |
| 2021 | $6,091 | $303,800 | $55,900 | $247,900 |
| 2020 | $6,087 | $299,400 | $55,500 | $243,900 |
| 2019 | $5,936 | $263,600 | $48,300 | $215,300 |
| 2018 | $5,492 | $250,300 | $45,300 | $205,000 |
| 2017 | $5,271 | $248,300 | $45,300 | $203,000 |
| 2016 | $5,080 | $234,100 | $45,300 | $188,800 |
| 2015 | $3,938 | $189,600 | $45,300 | $144,300 |
| 2014 | $3,928 | $199,000 | $45,300 | $153,700 |
Source: Public Records
Map
Nearby Homes
Your Personal Tour Guide
Ask me questions while you tour the home.