Estimated Value: $552,000 - $648,000
5
Beds
4
Baths
4,044
Sq Ft
$153/Sq Ft
Est. Value
About This Home
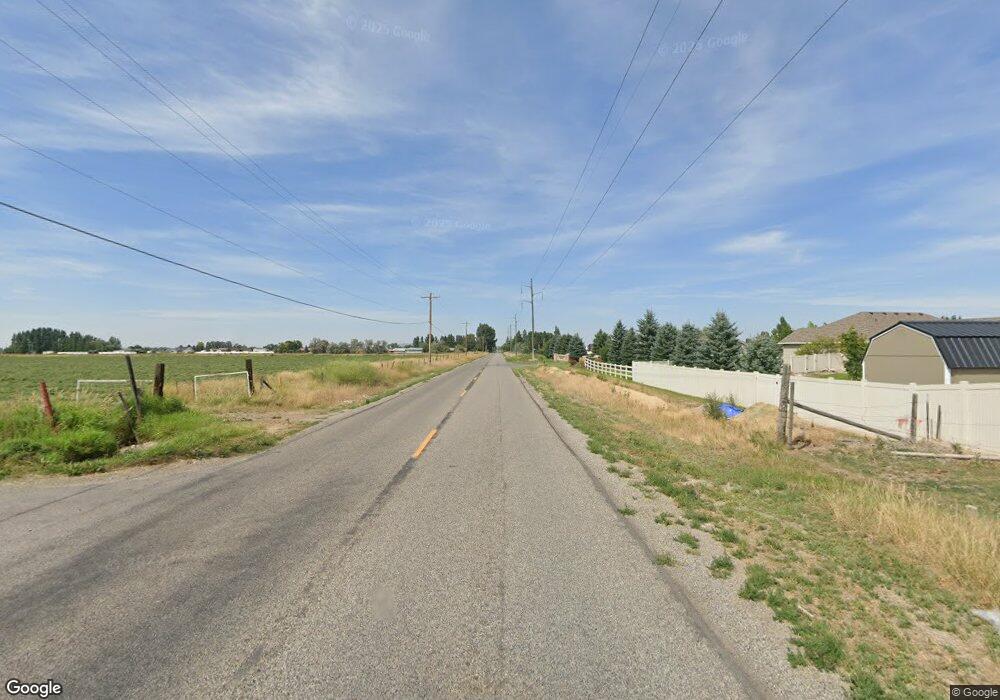
This home is located at 3780 E 175 N, Rigby, ID 83442 and is currently estimated at $618,507, approximately $152 per square foot. 3780 E 175 N is a home located in Jefferson County with nearby schools including Jefferson Elementary School, Rigby Middle School, and Rigby High School.
Ownership History
Date
Name
Owned For
Owner Type
Purchase Details
Closed on
Aug 24, 2011
Sold by
Hansen Glen A and Hansen Paula D
Bought by
Rodgers James and Rodgers Lisa Fay
Current Estimated Value
Home Financials for this Owner
Home Financials are based on the most recent Mortgage that was taken out on this home.
Original Mortgage
$185,000
Outstanding Balance
$127,253
Interest Rate
4.43%
Mortgage Type
VA
Estimated Equity
$491,254
Purchase Details
Closed on
Aug 17, 2006
Sold by
Beddes Hidee H and Beddes David Rayan
Bought by
Hansen Glen A and Hansen Paula D
Home Financials for this Owner
Home Financials are based on the most recent Mortgage that was taken out on this home.
Original Mortgage
$199,920
Interest Rate
6.76%
Mortgage Type
New Conventional
Create a Home Valuation Report for This Property
The Home Valuation Report is an in-depth analysis detailing your home's value as well as a comparison with similar homes in the area
Home Values in the Area
Average Home Value in this Area
Purchase History
| Date | Buyer | Sale Price | Title Company |
|---|---|---|---|
| Rodgers James | -- | -- | |
| Hansen Glen A | -- | -- |
Source: Public Records
Mortgage History
| Date | Status | Borrower | Loan Amount |
|---|---|---|---|
| Open | Rodgers James | $185,000 | |
| Previous Owner | Hansen Glen A | $199,920 |
Source: Public Records
Tax History Compared to Growth
Tax History
| Year | Tax Paid | Tax Assessment Tax Assessment Total Assessment is a certain percentage of the fair market value that is determined by local assessors to be the total taxable value of land and additions on the property. | Land | Improvement |
|---|---|---|---|---|
| 2024 | $1,865 | $555,402 | $0 | $0 |
| 2023 | $1,865 | $572,292 | $0 | $0 |
| 2022 | $2,648 | $500,736 | $0 | $0 |
| 2021 | $2,552 | $397,173 | $0 | $0 |
| 2020 | $2,025 | $360,483 | $0 | $0 |
| 2019 | $2,315 | $327,384 | $0 | $0 |
| 2018 | $2,036 | $287,913 | $0 | $0 |
| 2017 | $1,774 | $256,843 | $0 | $0 |
| 2016 | $1,801 | $156,857 | $0 | $0 |
| 2015 | $1,759 | $147,463 | $0 | $0 |
| 2014 | $1,711 | $142,765 | $0 | $0 |
| 2013 | -- | $145,407 | $0 | $0 |
Source: Public Records
Map
Nearby Homes