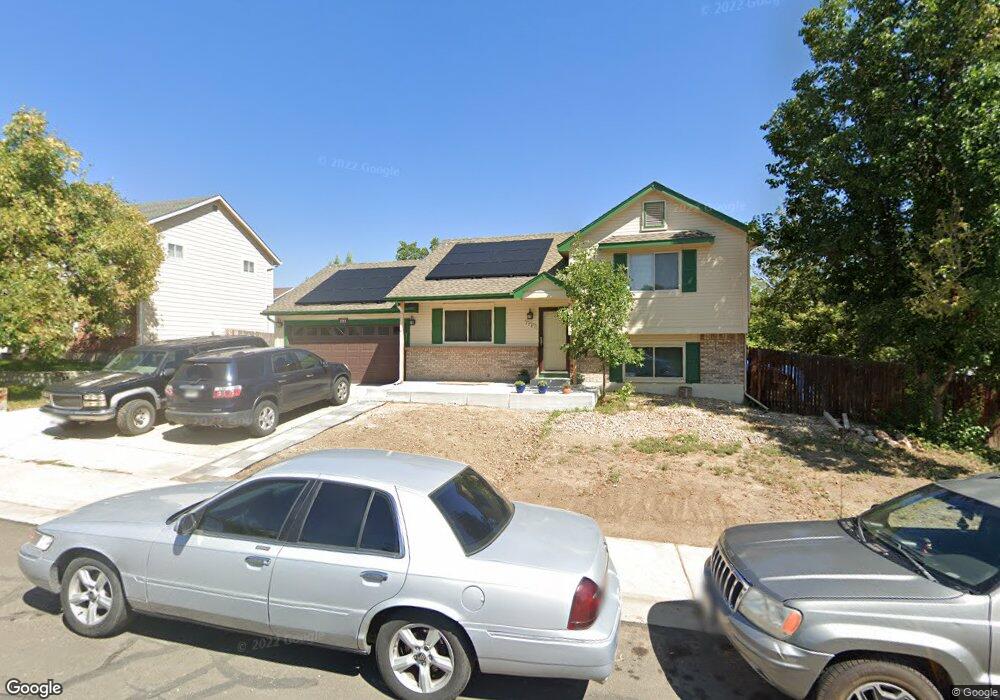
3781 E 99th Way Thornton, CO 80229
Quimby NeighborhoodEstimated Value: $448,663 - $467,000
4
Beds
2
Baths
1,468
Sq Ft
$311/Sq Ft
Est. Value
About This Home
This home is located at 3781 E 99th Way, Thornton, CO 80229 and is currently estimated at $457,166, approximately $311 per square foot. 3781 E 99th Way is a home located in Adams County with nearby schools including Trailside Academy.
Ownership History
Date
Name
Owned For
Owner Type
Purchase Details
Closed on
Jun 14, 2021
Sold by
Hoffman Darren P and Hoffman Anita L
Bought by
Arellano Brandon and Arellano Acosta Balerian
Current Estimated Value
Home Financials for this Owner
Home Financials are based on the most recent Mortgage that was taken out on this home.
Original Mortgage
$16,593
Outstanding Balance
$14,899
Interest Rate
2.93%
Mortgage Type
New Conventional
Estimated Equity
$442,267
Purchase Details
Closed on
May 11, 1999
Sold by
Layton Deborah L
Bought by
Hoffman Darren P and Hoffman Anita L
Home Financials for this Owner
Home Financials are based on the most recent Mortgage that was taken out on this home.
Original Mortgage
$130,500
Interest Rate
7.04%
Purchase Details
Closed on
Oct 1, 1991
Create a Home Valuation Report for This Property
The Home Valuation Report is an in-depth analysis detailing your home's value as well as a comparison with similar homes in the area
Home Values in the Area
Average Home Value in this Area
Purchase History
| Date | Buyer | Sale Price | Title Company |
|---|---|---|---|
| Arellano Brandon | $422,500 | Land Title Guarantee | |
| Hoffman Darren P | $145,000 | Land Title | |
| -- | $75,000 | -- |
Source: Public Records
Mortgage History
| Date | Status | Borrower | Loan Amount |
|---|---|---|---|
| Open | Arellano Brandon | $16,593 | |
| Open | Arellano Brandon | $414,846 | |
| Previous Owner | Hoffman Darren P | $130,500 |
Source: Public Records
Tax History
| Year | Tax Paid | Tax Assessment Tax Assessment Total Assessment is a certain percentage of the fair market value that is determined by local assessors to be the total taxable value of land and additions on the property. | Land | Improvement |
|---|---|---|---|---|
| 2025 | $2,776 | $30,330 | $6,120 | $24,210 |
| 2024 | $2,776 | $27,880 | $5,630 | $22,250 |
| 2023 | $2,753 | $33,220 | $5,750 | $27,470 |
| 2022 | $2,401 | $24,090 | $5,910 | $18,180 |
| 2021 | $2,265 | $24,090 | $5,910 | $18,180 |
| 2020 | $2,103 | $22,600 | $6,080 | $16,520 |
| 2019 | $2,115 | $22,600 | $6,080 | $16,520 |
| 2018 | $1,908 | $19,190 | $5,760 | $13,430 |
| 2017 | $1,869 | $19,190 | $5,760 | $13,430 |
| 2016 | $1,529 | $15,380 | $3,180 | $12,200 |
| 2015 | $1,337 | $15,380 | $3,180 | $12,200 |
| 2014 | -- | $11,910 | $2,310 | $9,600 |
Source: Public Records
Map
Nearby Homes
- 4117 E 98th Place
- 3480 E 100th Ct
- 9749 Albion Ln
- 9716 Ash Ln
- 10157 Garfield Cir
- 4286 E 98th Place
- 9645 Bellaire Ln
- 4210 E 100th Ave Unit 557
- 4210 E 100th Ave Unit 697
- 4210 E 100th Ave Unit 646
- 4210 E 100th Ave Unit 550
- 4210 E 100th Ave Unit 661
- 4210 E 100th Ave Unit 528
- 9730 Clermont Ln
- 9771 Cherry Ln
- 9767 Cherry Ln
- 4490 E 96th Place
- 4685 E 98th Place
- 4211 E 100th Ave Unit 452
- 10201 Riverdale Rd Unit 63
- 3761 E 99th Way
- 3782 E 99th Place
- 3762 E 99th Place
- 3721 E 99th Way
- 9926 Harrison St
- 3740 E 99th Way
- 3740 E 99th Way Unit Basement Apt.
- 9930 Harrison St
- 3720 E 99th Way
- 9920 Harrison St
- 3742 E 99th Place
- 3700 E 99th Way
- 3701 E 99th Way
- 3722 E 99th Place
- 9941 Harrison St
- 9940 Harrison St
- 3680 E 99th Way
- 3681 E 99th Way
- 3920 E 99th Ln
- 3709 E 98th Ct
Your Personal Tour Guide
Ask me questions while you tour the home.