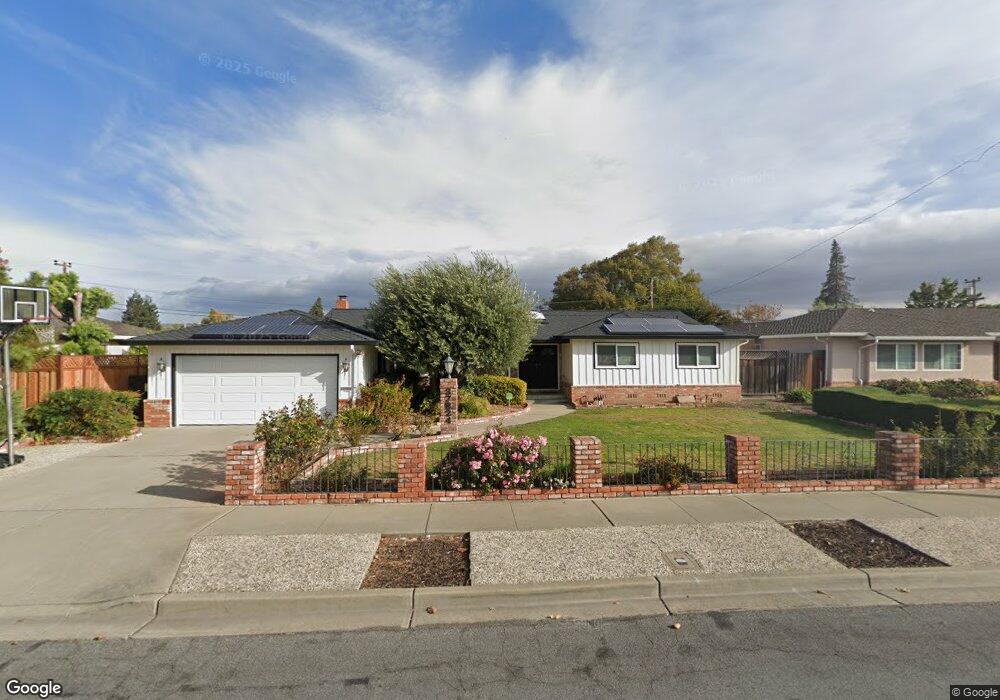
37824 Menard Ct Fremont, CA 94536
Glenmoor NeighborhoodEstimated Value: $1,663,000 - $2,138,000
3
Beds
3
Baths
1,905
Sq Ft
$969/Sq Ft
Est. Value
About This Home
This home is located at 37824 Menard Ct, Fremont, CA 94536 and is currently estimated at $1,846,401, approximately $969 per square foot. 37824 Menard Ct is a home located in Alameda County with nearby schools including Glenmoor Elementary School, Centerville Junior High School, and Washington High School.
Ownership History
Date
Name
Owned For
Owner Type
Purchase Details
Closed on
Jan 24, 2020
Sold by
Hashimoto Todd H and Hashimoto Debra S
Bought by
Hashimoto Todd and Hashimoto Debra
Current Estimated Value
Purchase Details
Closed on
Dec 4, 2012
Sold by
Rodes Dorothy E and The Rodes Residuary Trust
Bought by
Hashimoto Todd H and Hashimoto Debra S
Home Financials for this Owner
Home Financials are based on the most recent Mortgage that was taken out on this home.
Original Mortgage
$560,000
Outstanding Balance
$387,989
Interest Rate
3.37%
Mortgage Type
New Conventional
Estimated Equity
$1,458,412
Purchase Details
Closed on
Dec 26, 2006
Sold by
Rodes Mary B and Rodes Residuary Trust
Bought by
Rodes Mary B and Rodes Dorothy E
Purchase Details
Closed on
Aug 22, 2002
Sold by
Rodes Mary B and The Wilmer E & Mary B Rodes Li
Bought by
Rodes Mary B and Rodes Wilmer E
Purchase Details
Closed on
Feb 22, 1995
Sold by
Wilmer E Rodes & Mary B Rodes Living Tru
Bought by
Rodes Wilmer E and Rodes Mary B
Create a Home Valuation Report for This Property
The Home Valuation Report is an in-depth analysis detailing your home's value as well as a comparison with similar homes in the area
Home Values in the Area
Average Home Value in this Area
Purchase History
| Date | Buyer | Sale Price | Title Company |
|---|---|---|---|
| Hashimoto Todd | -- | None Available | |
| Hashimoto Todd H | $777,500 | Old Republic Title Company | |
| Rodes Mary B | -- | None Available | |
| Rodes Mary B | -- | -- | |
| Rodes Wilmer E | -- | -- |
Source: Public Records
Mortgage History
| Date | Status | Borrower | Loan Amount |
|---|---|---|---|
| Open | Hashimoto Todd H | $560,000 |
Source: Public Records
Tax History Compared to Growth
Tax History
| Year | Tax Paid | Tax Assessment Tax Assessment Total Assessment is a certain percentage of the fair market value that is determined by local assessors to be the total taxable value of land and additions on the property. | Land | Improvement |
|---|---|---|---|---|
| 2025 | $11,480 | $959,733 | $287,034 | $672,699 |
| 2024 | $11,480 | $940,918 | $281,407 | $659,511 |
| 2023 | $11,176 | $922,470 | $275,890 | $646,580 |
| 2022 | $11,037 | $904,388 | $270,482 | $633,906 |
| 2021 | $10,766 | $886,657 | $265,179 | $621,478 |
| 2020 | $10,811 | $877,569 | $262,461 | $615,108 |
| 2019 | $10,688 | $860,367 | $257,316 | $603,051 |
| 2018 | $10,481 | $843,501 | $252,272 | $591,229 |
| 2017 | $10,243 | $828,963 | $247,326 | $581,637 |
| 2016 | $10,073 | $812,712 | $242,477 | $570,235 |
| 2015 | $9,942 | $800,508 | $238,836 | $561,672 |
| 2014 | $9,727 | $780,828 | $234,158 | $546,670 |
Source: Public Records
Map
Nearby Homes
- 4586 Norris Rd
- 37621 Glenmoor Dr
- 38265 Corrigan Ct
- 4328 Cognina Ct
- Plan 1629 at Veranda
- Plan 1165 at Veranda
- Plan 1670 at Veranda
- Plan 1455 at Veranda
- Plan 1394 at Veranda
- Plan 1725 at Veranda
- Plan 1378 at Veranda
- Plan 1657 at Veranda
- 3810 Burton Common
- 37721 Madera Ct
- 3833 Burton Common
- 4737 Deadwood Dr
- 4715 Eggers Dr
- 4637 Rothbury Common
- 37001 Contra Costa Ave
- 4544 Thornton Ave
- 4420 Faulkner Dr
- 37844 Menard Ct
- 37835 Ralco Rd
- 37853 Ralco Rd
- 37864 Menard Ct
- 37823 Menard Ct
- 4436 Faulkner Dr
- 37843 Menard Ct
- 4421 Faulkner Dr
- 4429 Faulkner Dr
- 37863 Menard Ct
- 4413 Faulkner Dr
- 37871 Ralco Rd
- 4437 Faulkner Dr
- 4405 Faulkner Dr
- 37884 Menard Ct
- 37846 Ralco Rd
- 37822 Andrews Ct
- 37862 Ralco Rd
- 4444 Faulkner Dr