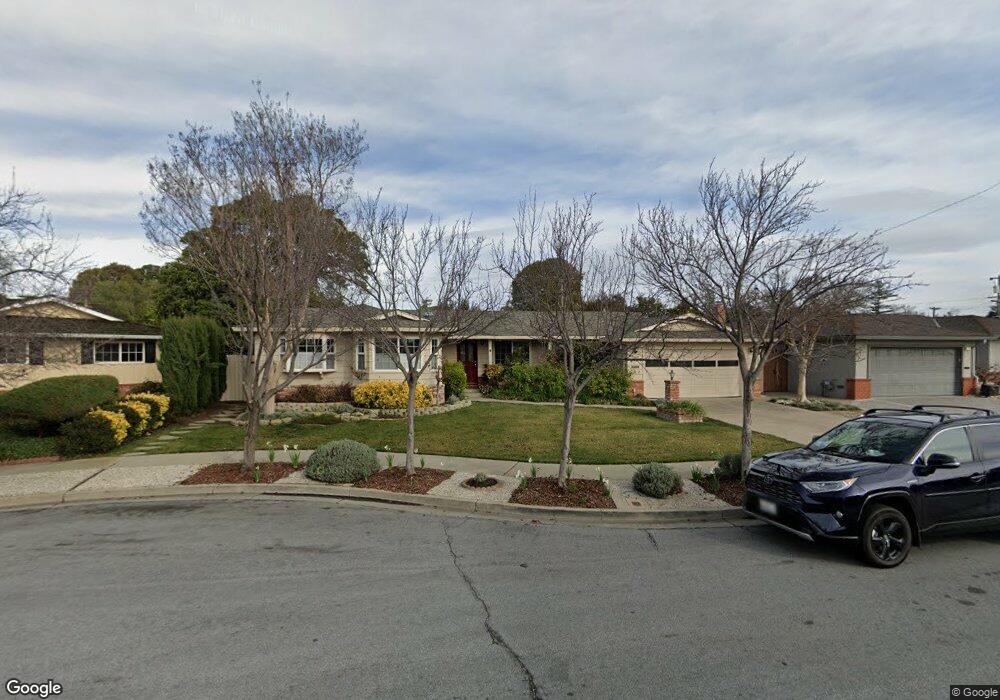
37832 Palmer Dr Fremont, CA 94536
Glenmoor NeighborhoodEstimated Value: $1,560,000 - $2,082,000
3
Beds
3
Baths
1,908
Sq Ft
$954/Sq Ft
Est. Value
About This Home
This home is located at 37832 Palmer Dr, Fremont, CA 94536 and is currently estimated at $1,819,814, approximately $953 per square foot. 37832 Palmer Dr is a home located in Alameda County with nearby schools including Glenmoor Elementary School, Centerville Junior High School, and Washington High School.
Ownership History
Date
Name
Owned For
Owner Type
Purchase Details
Closed on
Oct 1, 2020
Sold by
Nye William T and Nye Judith M
Bought by
Nye William Thomas and Nye Judith Marie
Current Estimated Value
Purchase Details
Closed on
Mar 8, 2002
Sold by
Mahon Larry L and Mahon Sandra J
Bought by
Nye William T and Nye Judy M
Home Financials for this Owner
Home Financials are based on the most recent Mortgage that was taken out on this home.
Original Mortgage
$370,000
Outstanding Balance
$152,165
Interest Rate
6.84%
Estimated Equity
$1,667,649
Purchase Details
Closed on
Mar 4, 1996
Sold by
Billings Donald H and Billings Marjorie M
Bought by
Mahon Larry L and Mahon Sandra J
Home Financials for this Owner
Home Financials are based on the most recent Mortgage that was taken out on this home.
Original Mortgage
$236,000
Interest Rate
6.12%
Create a Home Valuation Report for This Property
The Home Valuation Report is an in-depth analysis detailing your home's value as well as a comparison with similar homes in the area
Home Values in the Area
Average Home Value in this Area
Purchase History
| Date | Buyer | Sale Price | Title Company |
|---|---|---|---|
| Nye William Thomas | -- | None Available | |
| Nye William T | $590,000 | First American Title Guarant | |
| Mahon Larry L | $295,000 | Commonwealth Land Title Co |
Source: Public Records
Mortgage History
| Date | Status | Borrower | Loan Amount |
|---|---|---|---|
| Open | Nye William T | $370,000 | |
| Previous Owner | Mahon Larry L | $236,000 |
Source: Public Records
Tax History Compared to Growth
Tax History
| Year | Tax Paid | Tax Assessment Tax Assessment Total Assessment is a certain percentage of the fair market value that is determined by local assessors to be the total taxable value of land and additions on the property. | Land | Improvement |
|---|---|---|---|---|
| 2025 | $10,458 | $867,894 | $261,464 | $613,430 |
| 2024 | $10,458 | $850,742 | $256,338 | $601,404 |
| 2023 | $10,178 | $840,927 | $251,313 | $589,614 |
| 2022 | $10,047 | $817,438 | $246,385 | $578,053 |
| 2021 | $9,799 | $801,276 | $241,555 | $566,721 |
| 2020 | $9,830 | $799,990 | $239,079 | $560,911 |
| 2019 | $9,681 | $781,307 | $234,392 | $546,915 |
| 2018 | $9,492 | $765,990 | $229,797 | $536,193 |
| 2017 | $9,254 | $750,974 | $225,292 | $525,682 |
| 2016 | $9,096 | $736,254 | $220,876 | $515,378 |
| 2015 | $8,976 | $725,197 | $217,559 | $507,638 |
| 2014 | $8,821 | $710,997 | $213,299 | $497,698 |
Source: Public Records
Map
Nearby Homes
- Plan 1629 at Veranda
- Plan 1165 at Veranda
- Plan 1670 at Veranda
- Plan 1455 at Veranda
- Plan 1394 at Veranda
- Plan 1725 at Veranda
- Plan 1378 at Veranda
- Plan 1657 at Veranda
- 38265 Corrigan Ct
- 3810 Burton Common
- 3833 Burton Common
- 4586 Norris Rd
- 37621 Glenmoor Dr
- 4328 Cognina Ct
- 37637 Canterbury St
- 38030 Dundee Common
- 3507 Buttonwood Terrace Unit 203
- 4737 Deadwood Dr
- 4237 Garland Dr
- 37721 Madera Ct
- 37848 Palmer Dr
- 4151 Avalon Ct
- 37816 Palmer Dr
- 4152 Avalon Ct
- 4135 Avalon Ct
- 37864 Palmer Dr
- 4311 Faulkner Dr
- 4314 Faulkner Dr
- 4136 Avalon Ct
- 37857 Palmer Dr
- 4134 Argyle Ct
- 4119 Avalon Ct
- 4319 Faulkner Dr
- 4120 Avalon Ct
- 4150 Argyle Ct
- 4328 Faulkner Dr
- 4217 Lombard Ave
- 4118 Argyle Ct
- 4157 Lombard Ave
- 37880 Palmer Dr